4 TPH Fundamentals
Petroleum release sites are often evaluated for potential environmental impact based on screening levels, or risk assessments, of a few individual compounds with well-characterized toxic effects typically found in petroleum products. However, petroleum releases originating from crude oil or crude oil-based products (e.g., gasoline, diesel fuel) contain complex mixtures that must be understood thoroughly to adequately assess risk, especially in scenarios wherein the “typical” toxic compounds are no longer present.
Understanding the properties of petroleum hydrocarbons in the environment (mobile or residual) is essential for developing accurate conceptual site models (CSM) to appropriately evaluate and manage the human health and ecological risks of petroleum hydrocarbons in environmental media (see Human Health Risk and Ecological Risk Assessment).
Petroleum hydrocarbons are unique in environmental site assessment and management because they are complex mixtures of compounds with wide-ranging physical and chemical properties. Following their release into the environment, these complex petroleum mixtures are subject to change due to a multitude of processes commonly referred to as weathering (e.g., volatilization, dissolution, biodegradation, oxidation, etc.).
Assessment of these mixtures is through the estimation of total petroleum hydrocarbons (TPH), a gross quantification without identification of individual constituents. In general, TPH is defined as the measurable amount of petroleum hydrocarbon in an environmental media. It is, thus, dependent on the analytical method used to measure TPH and the medium in which it is found. TPH values can be obtained from several analytical methods. The analytical methods may not limit the quantification solely to just hydrocarbons (i.e., compounds containing only hydrogen and carbon), but can include nonhydrocarbons from naturally occurring organic matter, chemicals, and petroleum-derived metabolites. The mixture will change as it weathers in the environment. Furthermore, compositions of mixtures quantified as “TPH” might be similar for nonaqueous phase liquid (NAPL), residual, and highly contaminated soils, but radically different for either water or air samples. This affects the assessment of risk to humans or ecological receptors. For a general understanding of risk assessment principles and information, see Risk Assessment Guidance for Superfund Sites USEPA 1989, Standard Guide for Risk-Based Corrective Action ASTM 2015a, and ITRC’s Risk 3 guidance documents ITRC 2015.
Because the composition of TPH is not consistent (its composition changes spatially and temporally across the contaminant plume), the assessment of health effects and development screening or target levels is problematic. A common approach to estimate risk is to assign TPH into fractions or groups of compounds based on analytical, fate and transport, and exposure considerations derived from the properties of the different petroleum hydrocarbon compound classes.
Essential topics included in this section are organized under the following headings:
- Petroleum chemistry and refining
- Physical and chemical properties of petroleum constituents, TPH carbon ranges (fractions), and metabolites
- Properties of aliphatic and aromatic hydrocarbon fractions
- Alterations of petroleum mixtures in the environment through weathering processes
- Definition of “TPH” in environmental media in risk assessment
4.1 Petroleum Chemistry and Refining
The physical and chemical behavior of a petroleum release is determined by the chemical makeup of the petroleum mixture, as well as site-specific factors, including but not limited to geology, geochemistry, climate, and microbiology.
4.1.1 Petroleum Chemistry/Composition
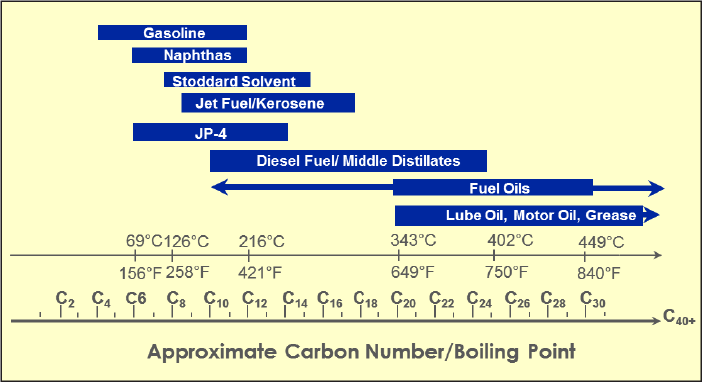
Crude oil contains hydrocarbons (i.e., molecules consisting only of carbon and hydrogen atoms) primarily with other organic compounds typically containing sulfur, nitrogen, or oxygen (i.e., heteroatoms) and inorganic constituents, such as metals. The chemical composition of unrefined crude varies depending on its source. During the refining process, crude oil is separated into fractions of different boiling point (BP) ranges such as naphtha, gasoline, jet fuel, diesel fuel, and heavier fuel oils. Crude oil and individual refinery products are typically characterized as TPH in environmental media.
4.1.1.3 Aliphatics and Aromatics
Petroleum hydrocarbons are organic compounds consisting of carbon and hydrogen atoms arranged in varying structural configurations. Because of differences in their environmental behavior, the most important hydrocarbon compound classes are aliphatics and aromatics. In general, aromatics are more water soluble than aliphatics with similar number of carbon atoms. Structural differences are of great significance in attenuation of the different types of hydrocarbons in the environment and what is present in TPH.
Aliphatic compounds are composed of straight-chained (also called paraffins), branched (isoparaffins), or cyclic compounds (naphthenes) and can be saturated (alkanes) or unsaturated (alkenes [olefins], alkynes, and others). Aromatic compounds have one or more conjugated benzene or heterocyclic rings within their structures and have moderate polarity that accounts for more water solubility. “Saturation” refers to whether all the valence electrons for any given carbon atom are involved in single bonds to other atoms. “Conjugated” refers to the presence of delocalized (shared) electrons within the chemical structure, such as in benzene. Common aliphatic and aromatic compounds are illustrated in Figure 4-3.
Within each hydrocarbon structural family and subfamily, there are homologous series. Each member of the series is termed a homolog and differs from adjacent members in the series by a repeating unit such as a methylene (CH2) group. Within a homologous series, physical properties of compounds change with the number of carbon atoms. For example, there is an increase in the BP of approximately 68oF (20oC) for each carbon atom added to an n-alkane chain. The persistence of petroleum hydrocarbon compounds in the environment increases with an increase in the compound’s BP for weathering processes caused by evaporation.
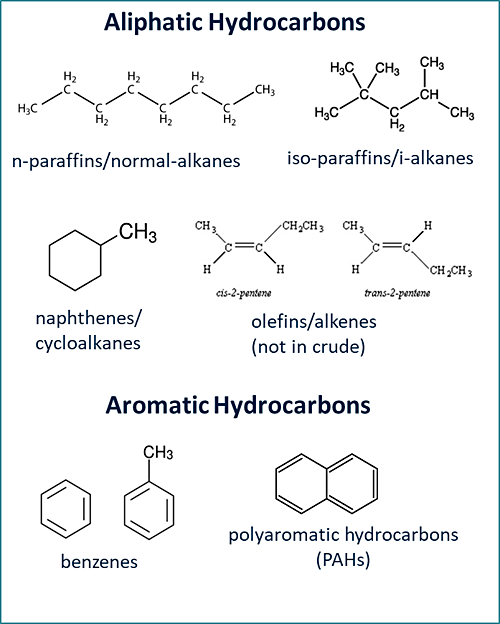
Figure 4‑3. Representative aliphatic and aromatic hydrocarbons.
Another key feature of petroleum hydrocarbons is that they typically have a large number of isomers. Isomers are compounds that have the same chemical formula, but have different structural configurations. As the carbon number increases, the number of possible isomers increases rapidly (Table 4-1). The large number of isomers is one of the main reasons why it is not feasible to identify and quantify all individual compounds in TPH.
Table 4‑1. Carbon number and isomeric paraffins
(Source: Wikipedia, 2018.)
| Carbon Number | Number of Possible Paraffin Isomers |
|---|---|
| 1 | 1 |
| 2 | 1 |
| 3 | 1 |
| 4 | 2 |
| 5 | 3 |
| 10 | 75 |
| 15 | 4347 |
| 20 | 366,319 |
| 25 | 36,797,588 |
| 30 | 4,111,846,763 |
| 40 | 62,491,178,805,831 |
4.2 Physical and Chemical Properties of Petroleum Constituents, TPH Carbon Ranges (Fractions), and Metabolites
Understanding the key physical and chemical properties of petroleum constituents and mixtures is critical to interpreting the partitioning processes by which chemicals are distributed in a multiphase system. Molecular structure, size, and polarity of hydrocarbons are key factors that determine how they will partition and be transported in environmental media (air, soil, water) and also correlate to toxicological effects. Because of the fundamentally different chemical structures of aliphatics, aromatics, and metabolites, and their resulting degrees of solubility, volatility, and adsorption, the compounds partition uniquely within the different media (Table 4-2). This can also result in different chromatographic patterns (see Conceptual Site Models and the Chromatograms Fact Sheet of the mixtures in water and soil vapor compared to those from LNAPL and soil.
The chemical structure, size, and polarity of a compound (or fractions) determine their volatility in soil, volatility in water, solubility in water, and adsorption to soil particles, as well as how it will be processed for measurement in an analytical laboratory (see Conceptual Site Models).
4.2.2 The TPHCWG Approach and Equivalent Carbon Number Definition
Hydrocarbons have many types of molecular structures with large numbers of isomers. It is not possible or practical to analyze each and every compound present in the environment at petroleum-impacted sites. However, groups of compounds within certain carbon ranges having similar properties can be defined and a representative toxicity for the mixture can be assigned for risk assessment purposes. The TPHCWG developed the concept of equivalent carbon (EC) number by correlating fate and transport of hydrocarbons based on BP to approximate carbon number or EC number. The EC is related to the BP of a chemical normalized to the boiling point of the n-alkane or its retention time in a boiling point gas chromatographic column (Figure 4-6). This relationship was empirically determined. Thus, for chemicals where only BPs are known, an equivalent carbon number can be easily calculated and physical properties estimated. The EC number is analogous to an n-paraffin retention index (RI). The National Institute of Standards and Technology (NIST) maintains an RI database (NIST 17 Gas Chromatography (GC) Method/Retention Index Library) for almost 100,000 compounds NIST 2017.
This concept can be applied to mixtures. TPHCWG grouped hydrocarbon fractions of similar partitioning characteristics by using ECs. As seen in Figure 4-6 and summarized in Table 4-2, aliphatic and aromatic hydrocarbons have significantly different water solubilities (within EC fractions) and Henry’s law constants and should be addressed separately in evaluation of risk.
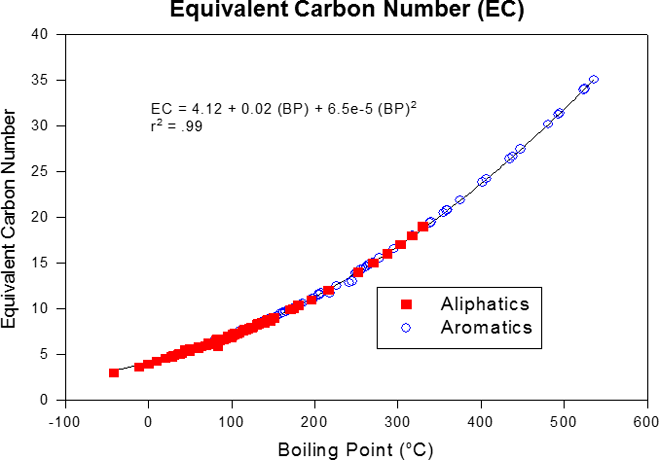
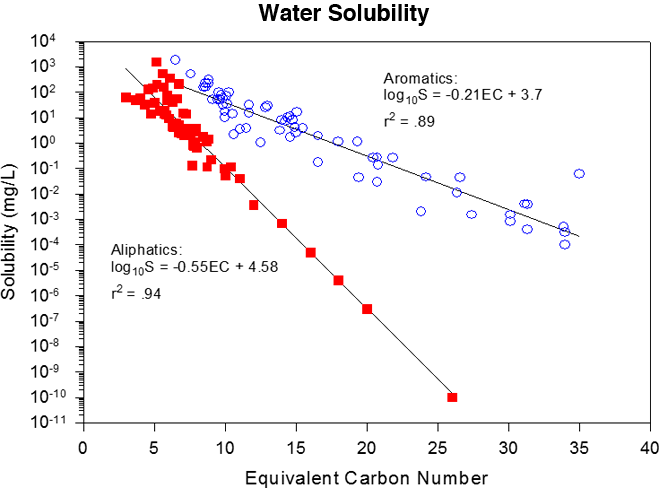
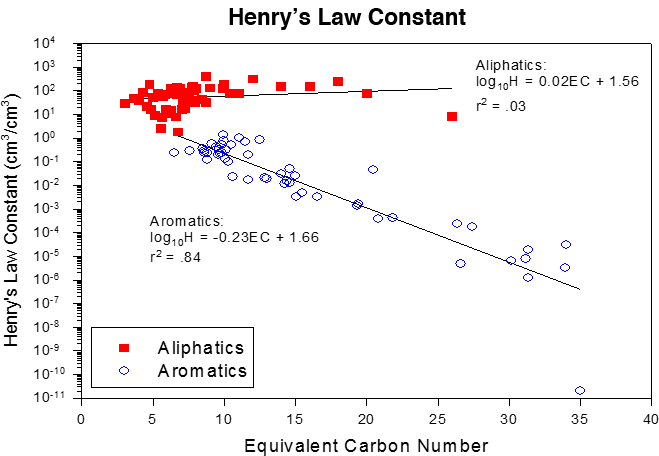
Figure 4‑6. EC number correlation with boiling point. Water solubility and Henry’s law constants correlations to ECs TPHCWG 1997c.
(Source: TPHCWG, 1997c.)
4.2.5 Limitations of Fractionation Approach
- Most TPH analytical methods are based on gas chromatography (see Conceptual Site Models and Investigative Strategies ). The TPHCWG fractions were developed for up to EC35, which is a practical upper range for analysis that can be achieved by most laboratories using standard current chromatographic equipment and encompasses most fuels. Additional work by American Petroleum Institute (API) extended the fractions used by the TPHCWG to EC 44 for aliphatic and aromatic fractions and an additional EC44+ combined aliphatic and aromatic fractions McMillen, Magaw, and Carovillano 2001.
- Crude oils and motor oils can have significant mass above EC 44 but analysis for higher carbons requires the use of high-temperature gas chromatographs, which are not common at commercial environmental laboratories (see Conceptual Site Models and Investigative Strategies). Excluding the >EC35 fraction has an impact on calculation of total risk of TPH for the <EC35 fraction, because the relative contribution of the >35 EC fraction is eliminated, meaning the <EC35 now represents 100% of the risk posed by TPH. This has effects on mass balance calculations and risk. For example, the risk of the <EC35 fraction might actually be 70% by mass balance, whereas ignoring the >EC35 fraction would lead to the <EC35 fraction representing 100% of the risk from TPH instead of the real 70% risk. This might lead to over- or underestimation of risk, depending on how much risk the >EC35 fraction contributes and what the composition is. Toxicological and fate and transport data for these heavier hydrocarbons (>EC35) are limited.
- The BP of the compound of interest on a nonpolar GC column is used to derive EC. The relationship between BP and EC is based on n-alkanes as markers. This is not a strict carbon count process. For a homologous series of the same carbon number, branched components have lower BPs than the straight-chain (n-alkane) isomers. Cycloalkanes and aromatic compounds generally have higher BPs than the n-alkane with the same number of carbons. The disparity between actual number of carbons and EC is greater for heavier PAHs. For modeling of transport and fate or risk assessment, it is suggested to select property values (e.g., solubility, etc.) at a midrange or those that represent a “worst-case” scenario. The midrange values appear to be more consistent when varied carbon ranges are applied; the “worst-case” scenario selection can be an order of magnitude more conservative than the average.
- Partitioning of biodegradation products (metabolites) has not been studied. Risk posed from petroleum releases includes risk from TPH and metabolites. The fraction approach only considers partitioning, measurement, and risk from nondegraded TPH. In general, polar metabolites are not accessible by the analyses because of incomplete extraction of metabolites by these methods, SGC removal, and lack of polar standards as standards for analysis.
4.3 Properties of Aliphatic and Aromatic Hydrocarbon Fractions
A summary table for the physical properties of the hydrocarbon carbon ranges fractions, as published by the TPHCWG, is provided in Table 4-2. A summary table of physical properties for example metabolites is provided in Table 4-3. Note that the addition of oxygen to the aliphatics (e.g., alcohols) changes the chemical and physical properties of the molecule. With addition of oxygen, the molecule becomes larger and more polarized. This leads to an increase in BP (and EC number), increased solubility in water, and decreased evaporation tendency compared to nonpolar aliphatics.
Table 4‑3. Example metabolite physical properties Kim et al. 2016
(Source: Kim et. al., 2016.)
| Compound | BP (°C) | EC1 | MW (g/mole) | S (mg/L) | VP (atm) | |
|---|---|---|---|---|---|---|
| Carboxylic Acids | Hexanoic Acid | 205 | 11 | 116.16 | 1.03×10+4 | 0.000057 |
| Alcohols | Hexanol | 157 | 8.9 | 102.177 | 5900 | 0.0012 |
| Aldehydes | Hexanal | 129.6 | 7.8 | 100.161 | 5640 | 0.0149 |
| Ketone | Hexanone | 127.2 | 7.7 | 100.161 | 14.7 | 0.0153 |
| 1 EC determined from EC boiling point correlation (EC=4.12 + 0.02(BP) + 6.5e-5(BP)2) of hydrocarbons after TPHCWG 1997b. | ||||||
4.3.1 Water Solubility of Fractions
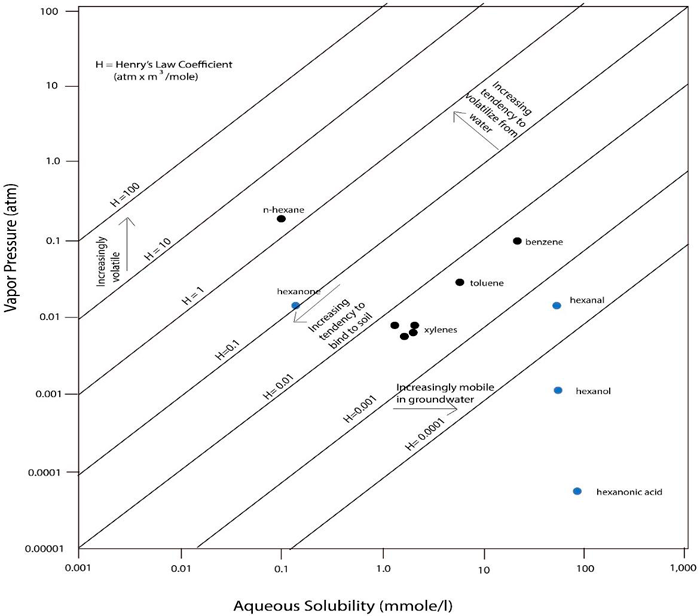
When compared within the same fraction (e.g., the same EC range, Figure 4-6) TPHCWG 1997c, aromatic hydrocarbons are more soluble compared to aliphatic hydrocarbons as a group. Aliphatics of lower EC (e.g., EC5–EC10) have a similar solubility to aromatics at higher EC (e.g., EC9–EC20). Addition of oxygen atoms to hydrocarbons, for example due to metabolism by bacteria, typically increases solubility. A comparison of the solubility of possible metabolites with the solubility of the corresponding parent hydrocarbon (n-hexane: 9.5 mg/L) shows the following trend: carboxylic acid (e.g., n-hexanoic acid) > alcohol (e.g., n-hexanol) > aldehydes (e.g., n-hexanal) and ketones (e.g., n-hexanone) (Table 4-3) > alkane (e.g., n-hexane; unaltered hydrocarbon). Note also the increase in EC number for the hexanoic acid in response to the increased BP.
4.3.2 Volatilization of Fractions from Soil
Aromatics and aliphatics exhibit a similar (i.e., negative) correlation of EC with vapor pressure (VP) for ECs smaller than 25, indicating a higher vapor pressure for low EC compounds TPHCWG 1997c. As a result, the partitioning of aromatics from aliphatics within the same EC range or as groups is not expected, meaning aliphatics and aromatics behave similarly during evaporation from dry soil and are both enriched in soil vapor. Vapor pressure values for equivalent carbon numbers greater than EC25 were excluded due to the low confidence in the measured estimates of vapor pressure values less than 10-9 atm. If vapor pressure of metabolites (Table 4-3) is compared to vapor pressure of their respective parent aliphatic hydrocarbons (Table 4-2), vapor pressure of some metabolites may be lower than those of the hydrocarbons. Vapor pressure decreases with chain length of metabolites and increases from acids to alcohols to aldehydes and ketones in the example. Aldehydes and ketones evaporate more readily from soil than alcohols.
4.3.3 Volatilization of Fractions from Water
TPH in vapors from both gasoline and mid-distillate fuels is generally dominated by low-carbon range aliphatics, while low-carbon range aromatics are minor, though still important.
The Henry’s law constant decreases with increasing EC of the aromatics, while it is more or less constant for the aliphatics at all ECs (Figure 4-6) TPHCWG 1997c. Henry’s law constants for the aliphatics are generally greater than 1.0, while those for the aromatics are generally less than 1.0 in Figure 4-6. The aromatics generally prefer to be in the aqueous phase compared to the aliphatics, whereas aliphatics prefer the vapor phase. Within EC fractions, aliphatics are also distinctly different from aromatics in their Henry’s law constants. This has the effect that TPH in vapors from both gasoline and mid-distillate fuels is generally dominated by low-carbon range aliphatics while low-carbon range aromatics in vapors are a minor, though still important, fraction of TPH in vapors Brewer et al. 2013; ITRC 2014.
4.3.4 Adsorption (Sorption) of Fractions (Koc)
The soil organic carbon-water partitioning coefficient (Koc) is the ratio of the mass of a chemical that is adsorbed in the soil per unit mass of organic carbon in the soil per the equilibrium chemical concentration in solution. Koc values are useful in predicting the mobility of organic soil contaminants; higher Koc values correlate to less mobile organic chemicals, whereas lower Koc values correlate to more mobile organic chemicals. The organic carbon content of soil is the primary property controlling sorption of hydrocarbons (non-ionic hydrophobic chemicals), but partitioning can also be influenced by adherence to clay particles. For example, if the soil carbon content is less than 0.001, clay content dominates the partitioning behavior. Furthermore, the kind of clay (kaolinite and montmorillonite, for instance) is also important Jorge 2001.
In general, the higher the ECs, the more aliphatics and aromatics partition into soil compared to fluids. When PAHs and BTEX are compared, Kocs for PAHs are generally higher (at least an order of magnitude), indicating that PAHs are preferentially partitioned into the soil relative to BTEX. Concentrations of the compounds are a function of initial concentration and Koc.
The slope of Koc with EC number of the aliphatics is much steeper than for aromatics with EC range >10–12 TPHCWG 1997c. Compared to the aromatics at the same EC, aliphatics tend to be bound more tightly to soil in the EC10–EC20 range. However, most aliphatics and aromatics have similar Koc (as combined aliphatics and aliphatic groups comprising the complete EC range) and therefore will be found in similar proportions in soil based on the EC-Koc relationship alone.
4.4 Alterations of Petroleum Mixtures in the Environment Through Weathering Processes
The term “weathering” describes physical, chemical, and biological (biochemical) changes that affect hydrocarbons and alter the composition of petroleum hydrocarbon mixtures after they are released to the environment Atlas 1981. When weathering processes reduce the mass of a release, this is often called “natural attenuation.” Biochemical processes are catalyzed by microorganisms and collectively known as “biodegradation.” Because each petroleum release site is unique and not all weathering processes are of equal importance at all sites, understanding the scientific principles can help with site management decisions.
4.4.1 Overview of Weathering Processes
Different weathering processes can occur simultaneously and/or sequentially. The extent to which a given process occurs depends on the nature of individual hydrocarbons and site characteristics. Not all of these natural changes involve structural transformation or degradation. “Degradation” can mean either a small structural modification (partial degradation) or complete breakdown to single carbon compounds. The fully oxidized carbon can be released as gaseous carbon dioxide (CO2) or a dissolved inorganic ion bicarbonate (HCO3–) in a process called mineralization.
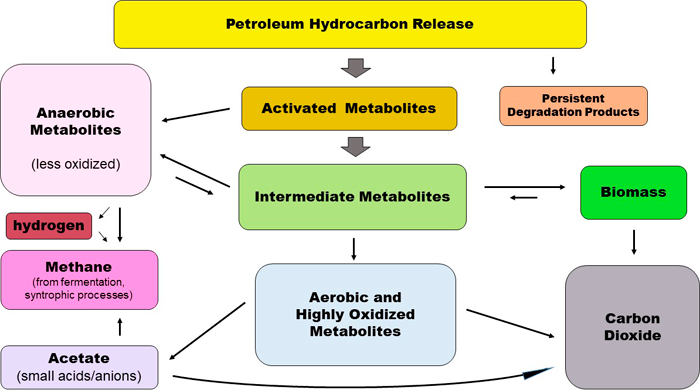
Hydrocarbon degradation always involves oxidation because hydrocarbons are highly reduced chemicals containing only hydrogen atoms at the ends of carbon chains or rings. The hydrogen atoms make the carbon atoms slightly negative and provide excess electrons that can be transferred to oxygen through reactions that produce energy. Biodegradation by microorganisms involves transfer of electrons from the carbon atoms to suitable electron acceptors. This causes one or more of the carbon atoms to become somewhat positive and linked to oxygen atoms. Biodegradation of petroleum hydrocarbon mixtures always involves many steps and produces numerous partial degradation products. These are organic chemicals also known as “metabolites” or “polar compounds” with different characteristics and behaviors in the environment. In polar molecules, electrons are not shared equally among atoms of the same molecule, leading to one end being more positive and another more negative. Thus, the incorporation of oxygen by biodegradation or photooxidation of petroleum hydrocarbons results in formation of oxygen-containing compounds that are more water soluble than the corresponding parent hydrocarbon (see Table 4-3).
Figure 4-8 depicts processes contributing to weathering. Physical processes redistribute hydrocarbons in the environment without changing structures. Chemical and biochemical processes change the structures and properties of hydrocarbons mostly through oxidation. For instance, photooxidation can lead to partial oxidation and affects only certain hydrocarbons. Biodegradation is a comparatively slow, stepwise chemical oxidation process that requires the successive action of many different types of microorganisms and a great variety of biological catalysts (enzymes) to process the many different hydrocarbon structures present in a typical petroleum release. Because biodegradation of petroleum hydrocarbons is a complex multistep process, many intermediate breakdown products or metabolites are generated. These undergo increasing oxidation with time and distance from the source zone.
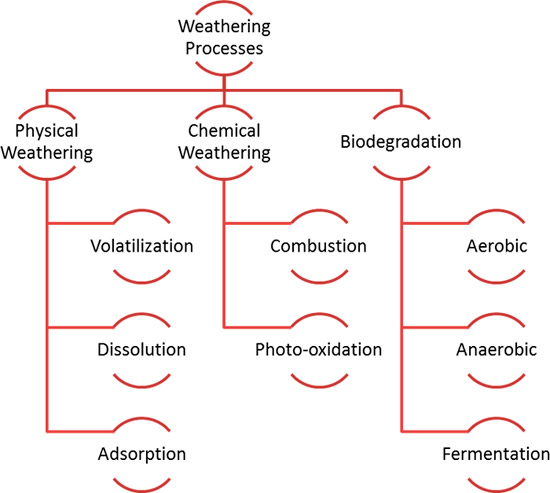
Figure 4‑8. Weathering processes that can affect hydrocarbon mixtures.
(Source: U. Johnson, Georgia EPD, 2018.)
Weathering changes the composition of the original mixture because different types of hydrocarbons vary in their susceptibility to physical, chemical, and biological transformation. For example, small aliphatic hydrocarbons evaporate easily and large aromatic hydrocarbons adsorb onto clayey soil. One of the major changes when microorganisms start oxidizing hydrocarbons is that those products (metabolites) move with the water due to their polar nature. Below is a simplified conceptual site model with parent hydrocarbons in yellow and metabolites in red. Understanding the factors involved in the breakdown of hydrocarbons and the limitations of different weathering processes is important for making informed site management decisions.
The conceptual site model (CSM) in Figure 4-9 illustrates key weathering processes and the production of petroleum metabolites in the environment. The parent hydrocarbons are in yellow (in the NAPL phase) and the metabolites are the red “molecules” shown in the different phases of the plume. Parent compounds released at the surface can undergo photooxidation (1) or evaporation following volatilization (2). Metabolites are also produced as a result of photooxidation. As the hydrocarbons travel downward from the surface through the vadose zone, (partial) biodegradation of hydrocarbons (3) occurs, yielding metabolites, with biodegradation becoming more anaerobic as oxygen levels drop. The NAPL can also penetrate the water table and result in both submerged and vadose zone source areas. Slow anaerobic biodegradation can occur in NAPL but more biodegradation occurs in the fringe. Parent hydrocarbons can also be absorbed onto soil particles (4). Hydrocarbons are transferred from the petroleum mass (NAPL) to water through dissolution (5). The polar metabolites partition preferentially into the water phase. As dissolved hydrocarbons and metabolites move away from the source area, they are subject to dilution (6). Formation of metabolites and further oxidation, as well as fermentation of metabolites, may continue under anaerobic conditions.
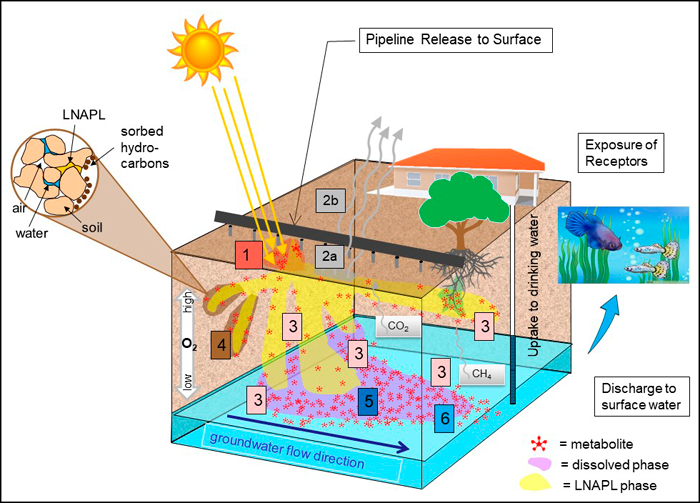
Figure 4‑9. Conceptual site model for petroleum weathering and metabolites
Biodegradation—the right mix matters:
- Moisture
- Mass
- Microbes
4.4.3 Biodegradation Overview
Biodegradation is a term used to collectively describe a variety of (bio)chemical processes by which microorganisms transform or alter (through metabolic or enzymatic action) the structure of chemicals introduced into the environment. Biodegradation is the most important and universal weathering mechanism. Most hydrocarbon mixtures can be at least partially degraded in the environment due to the presence of ubiquitous microorganisms. Microbes that use oxygen are very effective at breaking down petroleum hydrocarbons. Biodegradation of a hydrocarbon mixture requires many types of microorganisms or a “consortium” of microorganisms, which often consists of different strains of bacteria but can also include fungi, algae, and archaea. The microorganisms are often divided into aerobic and anaerobic species. Aerobic organisms thrive in the presence of oxygen and use oxygen as terminal electron acceptor (TEA). Anaerobic organisms use a variety of alternative TEAs, for example, sulfate or nitrate from the environment. Biodegradation is most rapid where adequate oxygen is available and mixes readily with the hydrocarbons. When conditions turn anaerobic, certain hydrocarbons, including benzene and PAHs, may degrade very slowly. Large quantities of TEAs are required for hydrocarbon breakdown (see Chemistry of Weathering Processes Fact Sheet). Microbial processes that use as TEAs organic molecules generated during their own metabolic activities are sometimes called fermentation. Different types of anaerobic processes can occur at the same site in close proximity Meckenstock et al. 2015. The rate, type, and extent of biodegradation depend on the nature of the hydrocarbons and site-specific factors.
4.4.5 Evidence for Weathering
The effects of weathering, including biodegradation, are often readily apparent at typical or simple sites. Even at complex or recalcitrant sites (e.g., significant mass; unique geochemical, microbial, etc., conditions), some biodegradation of hydrocarbons virtually always occurs, but progress in the reduction of environmental contamination may not always be readily apparent. Careful monitoring of weathering and, in particular, biodegradation processes, is the key to regulatory acceptance of monitored natural attenuation (MNA) USEPA 1999. Some, but not all, of the methods below are also commonly used for investigation of natural source zone depletion (NSZD) of LNAPL sources ITRC 2018. NSZD tends to focus on large masses and mass flux regardless of the weathering (attenuation) mechanisms, whereas MNA tends to focus on residual concentrations in environmental media that favor biodegradation. Considering mass flux only in the evaluation of natural attenuation is not sufficient because different types of hydrocarbons or TPH fractions have different toxicities and different susceptibilities to biodegradation or other weathering processes. Multiple lines of evidence are often recommended at complex or recalcitrant sites. A list of methods that can be used for evaluating weathering processes is provided below:
- Water quality parameters: Biodegradation of petroleum hydrocarbons causes changes in the chemistry of groundwater. After dissolved oxygen has been depleted, microorganisms use the electrons acceptors (ions) that are available. Tabulating or graphing contour maps that show decreasing TEAs (including O2) and an increase in byproducts can provide a line of evidence. By quantifying these changes, it may be possible to document that biodegradation is occurring.
- Chromatograms produced as part of TPH analysis: Chromatograms typically provide initial qualitative evidence of weathering and can be easily obtained from the testing laboratory.
- Comparison of duplicate TPH samples processed with and without silica gel cleanup (SGC): Lower bulk TPH concentrations with SGC can indicate partial degradation of petroleum hydrocarbon, but site information is also required for proper interpretation CASWB-SFBR 2016b.
- Molecular methods: Methods such as quantitative polymerase chain reaction (qPCR) have become readily available in recent years for evaluating sites contaminated with various chemicals and mixtures including petroleum. A qPCR analysis is based on the amplification of genetic signatures that allows identification and quantification of microorganisms or active genes. Quantitation helps predict whether natural attenuation will likely be adequate (see Environmental Molecular Diagnostics, New Site Characterization & Remediation Enhancement Tools ITRC 2013). These methods also may provide information on how biodegradation could be enhanced.
- Isotope-based methods: Isotopes have been extensively used for decades in laboratory studies of microbial biodegradation of individual hydrocarbons and mixtures. Several isotopic methods such as compound-specific isotope analysis (CSIA) and stable isotope probing (SIP) are increasingly being used in the field and approved by regulatory agencies for the investigation and management of petroleum sites, for example, see this presentation from Georgia Environmental Protection Division.
- Production of gases: Biodegradation produces CO2 and sometimes methane. Carbon dioxide flux can be an indicator of the natural losses of petroleum mass due to degradation. (See also Evaluating Natural Source Zone Depletion at Sites with LNAPL and the McCoy et al. 2015 article on CO2) Methane is evidence for methanogenic (anaerobic) degradation, but because methane gas often travels from the location where it is generated methane detections should be interpreted carefully.
- Temperature: Monitoring the increase of temperature may be an option at certain sites, particularly when there is significant mass of hydrocarbons. At sites with very active aerobic degradation an increase of temperature has been observed Sweeney and Ririe 2014. (See also Evaluating Natural Source Zone Depletion at Sites with LNAPL).
4.5 Definition of “TPH” in Environmental Media in Risk Assessment
4.5.1 Definition of TPH for Purposes of This Guidance Risk Assessment for Petroleum Releases
One of the important lessons learned from decades of petroleum site investigation and risk assessment is that the more the hydrocarbons, hydrocarbon classes and carbon ranges, and nonhydrocarbon organic components are separated from each other in the definition of TPH, the more accurate the site evaluation will be because the different components can be assigned their respective properties. Therefore, for the purpose of this guidance and based on best practices to improve investigation and risk assessment for petroleum releases, TPH is defined as:
the known or assumed aliphatic and aromatic hydrocarbon mixture (e.g., crude oil, fuel type, mixture of fuel types) originally released to the environment, or the remaining aliphatic and aromatic hydrocarbon mixture after weathering thereof, for LNAPL in soil, and sediment sample matrices, and the dissolved hydrocarbons that have partitioned from the hydrocarbon mixture into groundwater or surface water for the water matrix, and the volatilized hydrocarbons that have partitioned from the hydrocarbon mixture or the dissolved phase to the soil vapor for the air matrix.
Thus, TPH is defined by the aliphatic and aromatic hydrocarbon carbon range fractions covering the applicable carbon range based on the known or assumed original hydrocarbon mixture (or the weathered hydrocarbon mixture thereof), or the hydrocarbon fractions partitioned to water or air. In the case of uncertainty regarding what petroleum type was released to the environment, the aliphatic and aromatic carbon ranges should cover the entire potential range (e.g., EC5–EC35 for aliphatics and EC8–EC35 for aromatics). The analysis is limited to EC35 because most labs have a difficult time getting to EC44 without discrimination and significant column bleed.
TPH is defined by the analytical method used to measure it, and the methods used can be variable from state to state and even from lab to lab. The variability can be due to which organics are included in the analysis and which carbon ranges (BP ranges) are quantified and reported, as well as differences in calibration standards, extraction solvents, detection limits of equipment, and methods. TPH numerical results should be carefully evaluated when looking for trends, for instance, to ensure that apparent changes are due to site condition changes and not to analysis of TPH by different methods and/or labs.
The commonly used bulk TPH analyses are known to include all extractable organics within the specified BP range unless a cleanup is used to isolate the hydrocarbons. The bulk TPH analyses do not distinguish between aliphatic and aromatic hydrocarbons.
The calibration used for quantitation can be a whole product standard or a group of individual hydrocarbons. Besides inconsistency, these factors hinder the ability to accurately evaluate either fate and transport properties or risk posed by the residual petroleum.
In the original TPHCWG program, the individual target compounds of potential concern (such as hexane, BTEX, naphthalene, for instance) are included as “TPH” in the corresponding aliphatic and aromatic fractions, and are not subtracted from their respective carbon range fractions.
For this ITRC document, the approach is to use the TPHCWG procedure for fate and transport calculations; however, as is the long-standing practice in most regulatory programs, the individual compounds of potential concern are typically analyzed for and evaluated separately for risk assessment purposes. The biodegradation metabolites are not always included and not accurately estimated as “TPH” because their properties can be significantly different from hydrocarbons and these metabolites are not always extracted and/or are too polar to be analyzed by gas chromatography. However, some metabolites and/or naturally occurring organic matter can be “measured/ reported” as TPH and bias results.
In the best case, all data collected at the site would be aliphatic and aromatic carbon range fractions, but in reality, the analysis required for these data is relatively expensive and more complex, and there is almost always a need (by responsible parties and state tank funds) to use a less-expensive bulk hydrocarbon carbon range TPH analysis (e.g., hexane to dodecane (nC6–nC12), decane to octacosane (nC10–nC28), etc.) for most samples during site investigation (TCEQ Tier 1 ranges).
The bulk TPH analysis can be useful in an investigative approach for a variety of reasons, including (1) at the beginning to compare to a bulk hydrocarbon TPH screening level to see if the site or areas of the site “screen out” and do not need further detailed evaluation, (2) to select representative samples for aliphatic/aromatic carbon range (fractionated) analyses, or (3) for “lateral and vertical extent” investigation purposes. The bulk carbon range TPH should be hydrocarbons only to be comparable to the aliphatic and aromatic fraction data.
4.5.2 Fraction Approach for TPH for Risk Assessment
Based on the information provided in the previous sections, it is clear that use of the aliphatic and aromatic carbon range fraction approach for TPH is the current best practice for site characterization and risk assessment. This is the best way to account for the large differences in physical properties and toxicities of the different components of the mixture, and to account for changes in the relative proportions of the components in the mixture over time due to weathering.
Using the fraction approach as the primary site information for risk evaluation is consistent with regulatory programs in several states (see States Survey) (Regulatory Framework). Specific details are not captured by the bulk carbon range TPH methods. The use of bulk data to define TPH can result in poor understanding of the potential environmental mobility and/or toxicity of the petroleum present. If bulk TPH methods are used, it is highly recommended to request and submit chromatograms along with the result to the regulating agency and examine chromatograms for potential interferences from nonhydrocarbon sources, single or multiple chemicals from other sources, or the degradation stage. Additionally, if the bulk carbon range TPH did not include a cleanup to isolate hydrocarbons, the TPH is essentially a total extractable organics measurement and may or may not have relevant relationship to aliphatic and aromatic hydrocarbon content. As discussed previously, bulk carbon ranges for TPH could be used for initial site screening purposes or as a practical cost-saving measure for “lateral and vertical extent” characterization purposes after fractionated data are collected.
The typical TPH carbon range fractions (all are “equivalent carbon numbers” in terms of BPs relative to n-alkanes) for analysis and evaluation are shown in Figure 4-11 below.
| Aliphatics: EC5–EC6; >EC6–EC8; >EC8–EC10; >EC10–EC12; >EC12–EC16; >EC16–EC21; >EC21–EC35 Aromatics: >EC8–EC10; >EC10–EC12; >EC12–EC16; >EC16–EC21; >EC21–EC35 If using bulk hydrocarbon TPH data, the above carbon range fractions could be approximated by using EC6–EC12, >EC12–EC21, >EC21–EC28, >EC28–EC35 |

Figure 4‑11. TPH carbon range fractions.
These carbon ranges are generally consistent with the TPHCWG and those used by most states that have a fractionated approach and use BTEX to represent the EC6–EC9 aromatics fraction.
4.5.3 Biodegradation Metabolites
Some metabolites from biodegradation (as well as other oxygen-containing molecules present in the background and not a result of the release, e.g., phthalates, humic acids, etc.) can be included in a bulk carbon range TPH analysis if SGC is not used because the bulk TPH analysis provides an aggregate measure of all extractable organics and is not specific to petroleum hydrocarbons. The frequency and magnitude of the inadvertent inclusion of the metabolites in a bulk TPH analysis was brought to the attention of regulators, consultants, and responsible parties in the late 1990s Zemo and Foote 2003. Prior to that it was assumed by most regulatory programs and environmental practitioners that the entire bulk TPH quantitation was hydrocarbons.
The nature, fate, and toxicity of metabolites in groundwater at petroleum release sites has been the subject of recent active research Zemo et al. 2017; Mohler et al. 2013; Bekins et al. 2016, and whether or not to include the metabolites as TPH has been an active debate involving some regulatory agencies for the past couple of years HIDOH 2017; CASWB-SFBR 2016b. However, due to two important factors, it is best practice to differentiate the metabolites from parent TPH. These factors are:
- metabolites have significantly different chemical and physical properties than the hydrocarbons due to their polar molecular structure (e.g., much higher solubility),
- the toxicity of metabolite mixtures may be different from the toxicity of the hydrocarbons presumed to be present as TPH.
Improper identification of nonhydrocarbons such as metabolites and naturally occurring organic matter as TPH may mislead site characterizations and could confound investigations in the following ways:
- the location and concentration of the hydrocarbons could only be estimated
- concentration trends for the hydrocarbons would not be observed or understood
- site assessment and remediation strategies can also be compromised without a clear understanding of what’s there: hydrocarbons vs. metabolites. You can select (or design) the wrong type of remediation if you do not know what you have. Hence, the need for a comprehensive, three-dimensional site characterization and development of a detailed CSM that is continually updated as new data/information become available.
4.5.4 Individual Constituents
Individual compounds, shown in Table 4-5, are individual chemicals such as BTEX, MTBE, tert-butyl alcohol (TBA), naphthalene, and PAHs that have well-established chemical-specific toxicity values. The use of individual compounds as the basis for risk evaluation is well established ASTM 2015b, and the choice of surrogate compounds is dictated by the petroleum fuel release and the regional or state regulatory programs. If the release type(s) is unknown, then all of the individual compounds should be analyzed for, with the possible exception of organic lead and lead scavengers. For petroleum hydrocarbon oil, a set of individual chemicals is used in some regulatory programs but may include only a small fraction of the total oil compositional mass. Therefore, a possibility exists that all individual concentrations may meet or fall below individual chemical screening levels or criteria, but the remaining total oil concentration (or TPH) might still exceed risk-based levels (see Conceptual Site Models).
Even at petroleum-contaminated sites where BTEX, naphthalene, PAHs, etc., are not present or at concentrations below their applicable Tier 1/screening levels, TPH should still be assessed for risk.
It is important to emphasize that TPH is a way to assess what else may be in the environment that cannot be accounted for by determination of individual indicator compounds. Although the indicator compounds are often the risk drivers, there are situations when there are no target compounds above regulatory thresholds but the “unknown” mixture that is considered “TPH” may be triggering a more in-depth investigation.
Table 4‑5. Recommended individual compounds for assessment of petroleum releases in addition to TPH
| Compound(s) | Gasoline | Aviation Gasoline | Jet Fuel | Diesel | Heavier Fuels and Crude Oil |
|---|---|---|---|---|---|
| n-hexane | Y | Y | N | N | N |
| BTEXN | Y | Y | Y | Y | Y |
| 2-MN | Y | Y | Y | Y | Y |
| MTBE, TBA | Y | N | N | N | N |
| Organic (Alkyl) Lead (total and speciated)* | Y, for pre-1977 releases only, product only | Y | N | N | N |
| Lead Scavengers (EDB, EDC) | Y, for pre-1997 releases only | Y | N | N | N |
| 16 Priority Pollutant PAHs | N | N | N | N | Y |
Notes: Y = yes; N = no.
BTEXN = benzene, toluene, ethylbenzene, xylenes, naphthalene; 2-MN= 2-methylnaphthalene.
MTBE, TBA= methyl tert-butyl ether, tert-butyl alcohol (MTBE and other oxygenates were used approx. early 1990s to 2005; TBA is primarily a biodegradation metabolite from MTBE).
n-Hexane and 2-MN are analyzed so that conservative toxicity values for their respective carbon range fractions based on these two chemicals do not have to be used for risk assessment.
16 priority pollutant PAHs are from 40CFR401.15 CWA list. Other compounds may be required for waste oil releases. Recommended analytical methods for each matrix are provided in TPH Analytical Methods.
*Alkyl lead should be used only from GC/mass spectrometry (MS) or GC/electron capture detector (ECD) methods where the individual species are determined.
In addition to higher-quality concentration data provided by targeted analyses (e.g., GC-MS), analysis of individual compounds affords the opportunity to not have to default to the most conservative toxicity value for a TPH fraction that is based on a specific compound (e.g., n-hexane or 2-methylnaphthalene). For example, in some TPH risk-based regulatory programs, it may be possible to demonstrate that a specific surrogate (e.g., 2-methylnaphthalene) may not actually be present in the mixture and, if so, it may be possible to use an alternate surrogate to assess the potential toxicity of an individual fraction. It is also good practice to check any guidance pertinent to the jurisdiction of the site in question to identify whether this approach is acceptable (see Regulatory Framework).

