Appendix A. Fact Sheets
A.1 Definition of TPH—Don’t Let the Name Fool You
View A.1 Definition of TPH—Don’t Let the Name Fool You in Adobe PDF format
- The acronym “TPH” stands for “total petroleum hydrocarbons” and can be as surprising as a box of chocolates (Figure A1-1). The laboratory analyses might not be total, might not be entirely petroleum, and might not be entirely hydrocarbons, so careful examination of the meaning of the results is important.
- Petroleum hydrocarbons include crude oils and refined products and may consist of hundreds to thousands of individual compounds with wide-ranging physical and chemical properties.
- This complex mixture may be referred to by a number of different names: mineral oil, hydrocarbon oil, oil and grease, volatile hydrocarbons, gasoline range organics, diesel range organics, motor oil range organics, volatile range compounds, purgeable hydrocarbons, extractable hydrocarbons, etc.
- TPH data may be used for delineation of bulk oil in the environment, product identification, forensic evaluation of the potential leak source or sources, estimation of risk or hazard to people and the environment, selection of remedial options, and/or compliance monitoring.

Figure A1-1. TPH and chocolates
- Ideally TPH should quantify the total combined concentration of all the petroleum-derived hydrocarbons in an environmental media sample, but in reality it may not be Total, may not be Petroleum, and may not be just Hydrocarbons.
- TPH results depend on the analytical method:
- All petroleum constituents in an environmental sample are not captured.
- Nonpetroleum hydrocarbons are included (e.g., natural plant and animal organics).
- Nonhydrocarbons are included (e.g., halogenated solvents, PCBs).
- There is no one best method for measuring petroleum contamination, and in practice there are a variety of analytical methods and no analysis method can selectively measure:
- only petroleum-derived hydrocarbons.
- all of the petroleum-derived hydrocarbons in a sample.
- TPH analysis results are semiquantitative and may vary for the same sample analyzed:
- by different TPH methods
- with the same method twice
- The same TPH concentration may represent very different compositions and very different potential risks or hazards to human health and the environment
- at two sites
- at the same site in different media (waste, soil, sediment, water, air)
- Definitions for TPH vary for different regulatory jurisdictions and between analytical laboratories.
- There are no federal or EPA analytical methods developed specifically for TPH.
- TPH has typically been regulated under state programs.
- It is necessary to understand the analytical method used to interpret the TPH results obtained for a given sample.
- See the TPH Analytical Methods Fact Sheet for more information.
A.2 TPH Analytical Methods
View A.2 TPH Analytical Methods in Adobe PDF format
Understanding the analytical methods is crucial for the interpretation of TPH results.
- Definitions for TPH vary for different regulatory jurisdictions and for different analytical laboratories.
- The TPH analytical method defines the result; no single method may be appropriate for all types of petroleum hydrocarbons. The method choice may depend on the type of petroleum, the analyzed media (waste, soil, sediment, water, or air), regulatory requirements, degree of weathering, and the purpose of the data.
- Based on the details of the method used, TPH concentrations may be obtained as:
- a single concentration or specified carbon range concentrations (e.g., “diesel” or “medium” range) with or without removal of nonhydrocarbons
- fractionated by chemical class prior to analysis (e.g., aliphatics versus aromatics)
- There are no federal or EPA gas chromatography-based methods developed specifically for TPH.
- EPA SW-846 Method 8015C includes guidelines for gasoline range organics (GRO) and diesel range organics (DRO) and general comments about the applicability to petroleum hydrocarbons. These guidelines were added to a method that was originally developed for determining the concentrations of various nonhalogenated organic compounds (“RCRA compounds”) by GC/FID.
- TPH methods are typically defined under state programs. Most methods in use cite EPA SW-846 Method 8015C and qualify it as “modified.”
- TPH methods identified by a product type (gasoline range, diesel range, etc.) do not necessarily identify the presence of the specified product, but only that some of the measured material might fall in the compositional range of the named product.
- Expert evaluation of analysis results (including chromatograms) may help in assessing the product type.
- TPH analyses are defined by a required combination of collection, extraction, cleanup, separation, and quantification methods. Each of the TPH analysis steps has multiple options and will produce different results.
- If laboratories use the same extraction solvent, same extraction techniques, same calibration type standard, and same carbon range (or ranges), data should be comparable for petroleum hydrocarbons. However, the higher the proportion of metabolites in a sample the more difficult it is to obtain comparable results. Polar metabolites are more difficult to extract from environmental samples than hydrocarbons and they are less amenable to analysis and quantitation by gas chromatography.
- Variability and uncertainty may be somewhat higher than for single compound measurements.
- Additional sample preparation steps increase variability.
- Analysis results presented without listing the specifics for each of the collection, extraction, cleanup, separation, and quantification steps may be of limited or no use; they may cause problems in interpretation or make it impossible to compare results.
- CAUTION: You can’t always get what you want, but if you try sometimes you may get what you need:
- Different TPH analysis methods may be preferred by the project manager or responsible party.
- The same method may be performed differently by different laboratories.
A.3 Silica Gel Cleanup (SGC)
View A.3 Silica Gel Cleanup (SGC) in Adobe PDF format
What It Is
“Bulk” extractable TPH analyses such as SW-846 Method 8015B/C measure all organics present in a sample that (1) can be extracted using an organic solvent and (2) elutes on a gas chromatograph column within a selected boiling-point range. These extraction and quantitation methods are not specific to petroleum hydrocarbons, and the organics measured can include hydrocarbons (HCs) and nonhydrocarbons (non-HCs). SGC is a method used by the laboratory to “clean up” the sample extract before it is analyzed for TPH so that the extract contains primarily HCs. This cleanup is possible because of the different chemical properties between HCs and non-HCs. HCs contain only carbon and hydrogen atoms, and thus are relatively “nonpolar” molecules, and non-HCs contain an atom(s) in addition to carbon and hydrogen (such as oxygen, sulfur ,or nitrogen), and thus are relatively “polar” molecules. The most common non-HCs in groundwater or soil at petroleum release sites are:
- metabolites from biodegradation of the petroleum (e.g., compounds containing oxygen, such as organic acids and alcohols, etc.)
- natural organic matter (e.g., humic acids, etc.)
- sampling, laboratory, or ambient anthropogenic artifacts (e.g., phthalates or BPA)
- other nonpetroleum-related chemicals (e.g., chlorinated solvents)
What It Does
Silica gel (SG) is used for the cleanup because it is a polar substance and therefore adsorbs the polar non-HCs. The best SGCs are based on SW-846 Method 3630C, which is a column cleanup procedure (Figures A2-1 and A2-2). A glass column is packed with SG, the extract is poured onto the column, the SG preferentially adsorbs the polar non-HCs as the extract moves through the column, and the “cleaned up” extract is collected at the bottom and then analyzed for TPH. Lab surrogates are added to the extract before the procedure to monitor effectiveness of the procedure. Other SGC methods can be used and typically are based on adding a few grams of SG to the extract vial and shaking it for a specified time period. Research shows that the shake method is not as effective as the column cleanup for methylene chloride extracts.
How You Can Use It
SGC can be used for many reasons:
- To compare extractable TPH results to hydrocarbon (HC)-based regulatory criteria. SGC allows for an “apples-to-apples” comparison of HCs in the sample to HC-based criteria.
- To accurately measure the extractable-range HCs in the sample. SGC allows the HC signal not to be lost in the total organics mixture.
- To document that biodegradation is occurring at the site by comparing results for TPH without SGC to TPH with SGC for a single sample. Oxygen-containing compounds are removed from diesel during the refining process because they will have a detrimental impact on engine performance, so the difference between the without and with SGC is the non-HC content of the sample, which at many sites are the biodegradation metabolites.
- To provide better remediation design and monitoring. Non-HCs have much different physical and chemical properties than HCs, so understanding the site-specific content/proportions of the organics present is important.
- SGC CANNOT be performed on samples to be analyzed for volatile TPH (e.g., GRO/TPH-g) because (1) those samples are not extracted prior to being analyzed, and (2) the cleanup step could result in loss of volatiles.
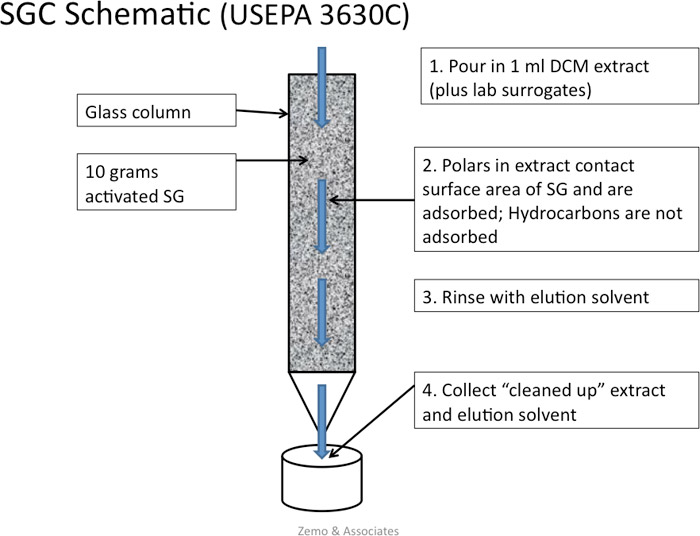
Figure A2-1. SGC schematic (USEPA 3630C)
(Source: Zemo and Associates, 2018.)
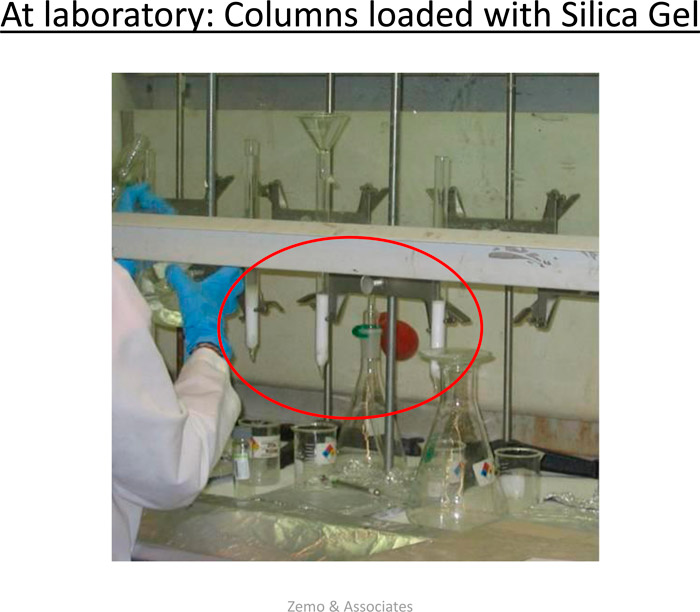
Figure A2-2. Laboratory column loaded with silica gel
(Source: Zemo and Associates, 2018.)
Note: Although not the focus of this fact sheet, a silica gel column is also used to separate aliphatic and aromatic HC classes for detailed “fractionated TPH” analyses; that method results in the separation of HCs and non-HCs as part of the procedure.
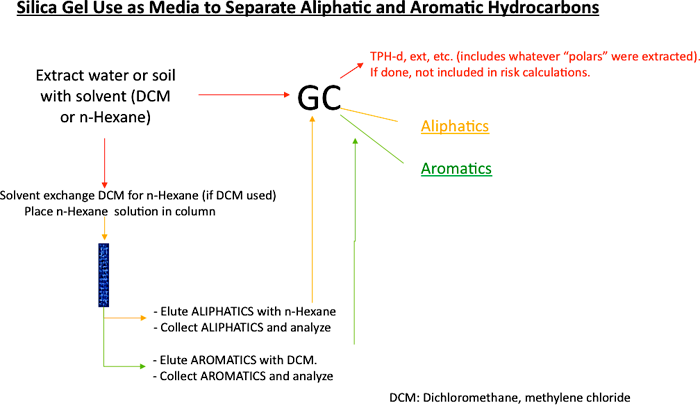
Figure A2-3. Silica gel use as media to separate aliphatic and aromatic hydrocarbons
A.4 Chemistry of Weathering Processes
View A.4 Chemistry of Weathering Processes in Adobe PDF format
Introduction
Many weathering processes, including biodegradation, involve chemical transformation. In general, the same chemical principles apply whether a reaction occurs in the presence of air and sunlight, inside a refinery reactor, or inside a living organism. Without help (catalysis) the main hurdle for chemical transformation is the energy barrier known as “energy of activation” that stabilizes hydrocarbons. If complete oxidation to carbon dioxide is desired, providing enough terminal electron acceptors may present another challenge.
Redox Reactions
Complete oxidation of hydrocarbons requires a large number of electrons, because hydrocarbons represent the most reduced form of carbon. To turn all of their carbon atoms into CO2, a large number of electrons will have to be accommodated elsewhere. The formal charge on the carbon in methane is –4 and –3 in the two carbon atoms of ethane. A formal charge of –2 could be assigned to the middle carbon atom of propane. Turning methane (CH4) into carbon dioxide (formal charge +4) involves the transfer of eight electrons. Ethane (C2H6) transfers 14 electrons, propane (C3H8) 20 electrons, hexadecane (C16H34) 98 electrons, and octadecane (C18H38) 110 electrons upon complete oxidation. Electrons can be released only in the presence of electron acceptors such as oxygen molecules, which can accept four electrons each. Examples of other electron acceptors are oxygen-containing inorganic compounds such sulfate or manganate ions or partially oxidized organic molecules. Living organisms use redox coenzymes as “electron shuttles” to move one or two electrons at a time from electron donor to electron acceptor. Not all reactions that lead to oxidation products are redox reactions; combustion and photooxidation involve radicals.
Thermodynamics
Thermodynamics provides information on whether a reaction would be favorable based on whether it would result in a net gain or loss of energy and how much energy could theoretically be obtained under ideal conditions. Thermodynamic data tables often contain experimentally determined energies (heats) of combustion. Based on thermodynamics, hydrocarbons are expected to release a large amount of energy upon complete oxidation. However, thermodynamics does not predict whether a chemical will actually undergo a reaction.
Kinetics
Kinetics provides information on the rate or speed of a reaction and whether a reaction is feasible. All chemicals that are stable under ambient conditions must overcome an energy barrier to undergo any transformation. A low energy barrier means that the chemical can be coaxed fairly easily into reacting. Hydrocarbons are fairly inert chemically at ambient temperature and pressure (Widdel and Rabus 2001; Labinger and Bercaw 2002; Hostettler et al. 2007; Rabus et al. 2016). This means that their energy barriers are high and that significant amounts of energy and/or catalysts are required to activate them initially to undergo any type of chemical or biochemical reaction. Catalysts break down reactions with large energy barriers into multiple steps with smaller energy barriers. Catalysts used in refineries or engines are often made of certain metals and are fairly nonspecific, whereas catalysts used in biodegradation are microbial enzymes that are very specific. The likelihood of a particular type of hydrocarbon undergoing transformation depends on the energy of activation. The “energy of activation” (Figure A4-1) is a kinetic concept and not to be confused with the energy of the reaction, which is a thermodynamic concept.
Energy profiles, also called reaction diagrams or reaction coordinate diagrams, are often used to illustrate kinetic concepts. Figure A4-1 illustrates three scenarios: hydrocarbon combustion, complete oxidation by aerobic microorganisms, and partial oxidation by anaerobic organisms. The biological processes can be divided into many steps, each of which requires energy of activation. The energy of activation for each of the steps is smaller than that for the big step in combustion, which makes it possible for these reactions to occur under normal ambient conditions and inside of living organisms.
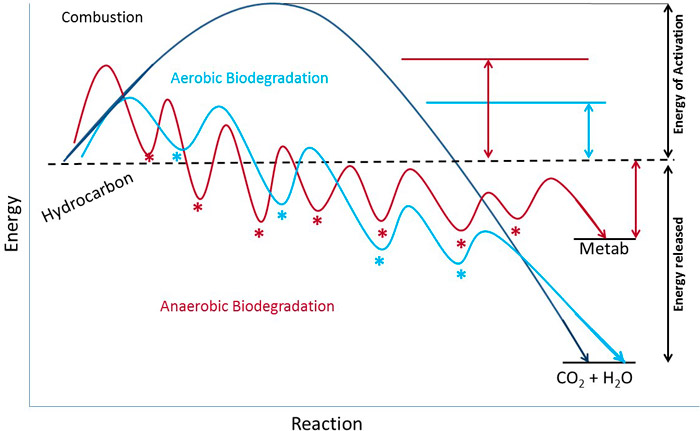
Figure A4-1. Kinetic strategies for the activation and degradation of hydrocarbons
This simple hypothetical reaction diagram provides a schematic illustration of the different kinetic strategies for the activation and degradation of hydrocarbons. Biodegradation is a type of chemical transformation that occurs in a stepwise manner and releases energy from hydrocarbons in small increments. The low-energy points marked with asterisks in the reaction paths for aerobic and anaerobic biodegradation represent metabolites.
Fatty Acids
Fatty acids are carboxylic acids that are found in all living organisms, where they have important functions. Many resemble aliphatic hydrocarbons with a COOH- (acyl-) group on one end. In cells, they often form esters.
Biochemical Reactions and Pathways
Biodegradation of a hydrocarbon always requires many steps, even when abundant oxygen is available. Aerobic degradation of an aliphatic hydrocarbon is typically initiated by the stepwise oxidation of a single carbon atom located on one end of the molecule to form a carboxylic acid, which is immediately esterified with a cellular factor to generate acyl-coenzyme A. Anaerobic processes can also generate acyl Co-A. This ester can undergo many rounds of β-oxidation and each round breaks off acetic acid units in the form of esters (Figure A4-2). There are many possible fates of the acetic acid units, especially under anaerobic conditions.
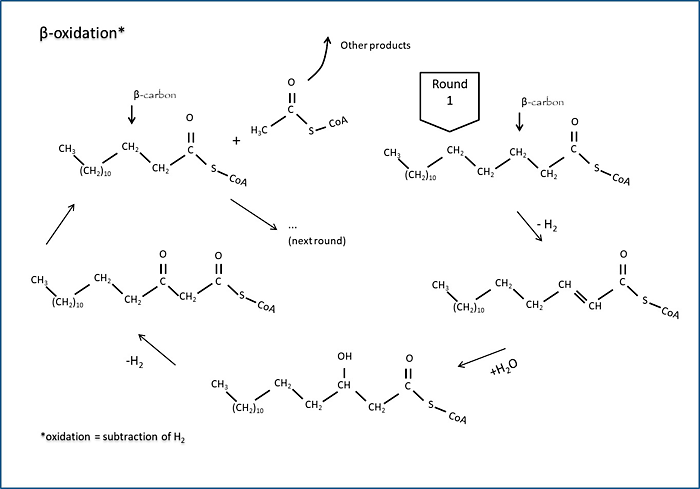
Figure A4-2. Beta-oxidation
This figure shows one round of β-oxidation, a widely used pathway for the degradation of many hydrocarbons after activation generates a terminal carboxylic acid. Oxidation occurs on the second or β-carbon from the acid group. The initial and final carboxylic acids are linked to coenzyme A, which is vitamin-derived thiol (alcohol with sulfur in place of oxygen) used for shuttling acids.
For maximum energy production, aerobic organisms feed acetyl-coenzyme A into the tricarboxylic acid (Krebs) cycle, which ultimately results in the generation of CO2 and energy. Alternative, acetyl-coenzyme A or the longer acyl-coenzyme A esters can be used for synthesis of new molecules, which facilitates growth of the microbial community and generation of biomass.
During anaerobic biodegradation of aliphatic as well as aromatic hydrocarbons the initial activation is the reaction with fumarate to generate succinates (Figure A4-3). The succinates are sometimes called “signature metabolites” and can be considered evidence of biodegradation (Beller, Ding, and Reinhard 1995; Young and Phelps 2005; Foght 2008; Agrawal and Gieg 2013; Rabus et al. 2016).
Coenzymes
Coenzymes help the main bio-catalysts (enzymes) by providing specific elements needed for a reaction such as electrons or functional groups. Many are derived from vitamins. Examples are redox coenzymes, which take electrons from oxidation reactions to where electrons are needed for reduction, or coenzyme A which temporarily binds organic acids at esters to facilitate their reuse by living organisms.

Figure A4-3. Fumarate addition for activation of alkanes
Pathway
A sequence of biochemical (enzyme-catalyzed) reactions that leads to a specific product. Example: A + B > C > D + 3E and D> F + G
The reaction also activates toluene under anaerobic conditions (Young and Phelps 2005) (Figure A4-4). A number of benzenes and naphthalenes can be activated in this way following alkylation. However, there is no single, predominant pathway for the complete degradation of hydrocarbons under anaerobic conditions and many outcomes and products are possible, depending on site conditions, microbial consortia and structural features of a given hydrocarbon.
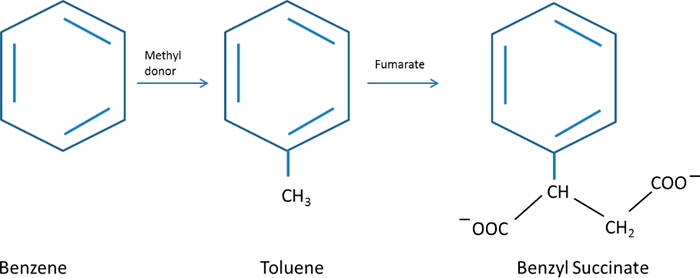
Figure A4-4. Generation of benzylsuccinate from toluene or from benzene that has been methylated
Biodegradation and photooxidation
These reactions can sometimes produce identical breakdown products even though the chemical strategies differ: Photooxidation requires multiple bonds and high energy (UV) light, while biodegradation requires the right overall (chemical and three-dimensional) structure so that a compound can bind to and interact with biological catalysts (enzymes), similar to a key fitting into a lock.
Formation of Metabolites
Stepwise petroleum degradation leads to partial breakdown products called “metabolites” or “polar compounds.” The latter term is used to indicate that they are more water soluble than the parent hydrocarbons. The term “metabolite” implies that a compound was formed by a living organism through enzyme action. Most of the partial breakdown products associated with terrestrial releases are metabolites. Occasionally, the same or similar products are formed by photooxidation (see text box). Because these oxygen-containing compounds may be chemically indistinguishable, we often refer to all breakdown products as “metabolites.” Intermediate metabolites are often more biologically active than the parent or starting compounds.
Signature Metabolites
Although many metabolites produced during the later stages of petroleum hydrocarbon breakdown may resemble naturally occurring molecules such as fatty acids, early metabolites have been identified that are clearly indicative of petroleum degradation. For example, succinyl adducts, which are formed by fumarate addition and are larger than the original hydrocarbons, are often the first readily detectable degradation intermediates of the anaerobic degradation of aliphatics as well as aromatics (Beller, Ding, and Reinhard 1995[; Young and Phelps 2005; Foght 2008; Agrawal and Gieg 2013; Rabus et al. 2016).
Persistent Metabolites and Partial Hydrocarbon Breakdown Products
Structural factors determine whether it is more or less difficult to degrade a certain type of hydrocarbon. For example, hydrocarbons with double bonds are often more easily degraded than those with single bonds only. Molecules with double bonds and aromatic systems may be altered by photooxidation in the presence of light that contains the appropriate wavelength. Although PAHs are one of the groups that are more difficult to degrade, they provide some good examples of (partial) oxidation through different processes. Due to their unsaturated nature, they can absorb energy from sunlight for the initial activation. Because an environment with sunlight also has adequate levels of oxygen, oxidation can occur through simple chemical reactions. However, many PAH metabolites do not have the right electron structures to interact with light of the spectral composition of sunlight and further oxidation to CO2 requires other mechanisms. An example of a PAH metabolite that can be generated either by photooxidation or biodegradation is anthraquinone (Figure A4-5), which can be produced during phenanthrene degradation.

Figure A4-5. Anthraquinone—a degradation product of phenanthrene
Anthraquinone can be produced by photooxidation (Mallakin et al. 1999) or microbial degradation of phenanthrene (Moody et al. 2001).
Difficult-to-degrade hydrocarbons can sometimes be activated through co-metabolism (partial transformation together with another, similar hydrocarbon (Dalton and Stirling 1982)). This can produce dead-end metabolites, which are partially oxidized molecules that cannot be processed further (Foght 2008; Heider et al. 1999). Anthraquinone is an example of a dead-end metabolite. Because microorganisms have difficulty degrading dead-end metabolites, those compounds may persist in the environment. Persistent metabolites can accumulate and cause product repression or inhibit degradation of other molecules (Kazunga and Aitken 2000). Product repression occurs when the product of an enzymatic pathway (a series of enzymatic reactions) shuts down a pathway once it reaches a certain concentration. This has also been observed for alkane degradation (Rojo 2009).
A.5 Chromatograms: A Wealth of Information
View A.5 Chromatograms: A Wealth of Information in Adobe PDF format
What Are Chromatograms?
Behind every TPH number calculated using a gas chromatography- (GC) based method, e.g., EPA Method 8015 and TX1005, is a chromatogram. Chromatograms record the magnitude of compounds as they elute off the GC and reveal the carbon range of hydrocarbons present in a sample. Other compounds, such as oxygen-containing compounds, elute at apparent higher carbon numbers than hydrocarbons with the same number of carbons. Compounds will elute according to their boiling point, with the most volatile compounds present on the left side of the chromatogram and the less volatile compounds present at increasing times on the x-axis as shown in Figure A5-1. The exact time a compound will appear in the chromatogram will vary depending on the GC method parameters and the stationary phase in the GC column, so calibration standards are needed to accurately determine the elution time for compounds of interest.
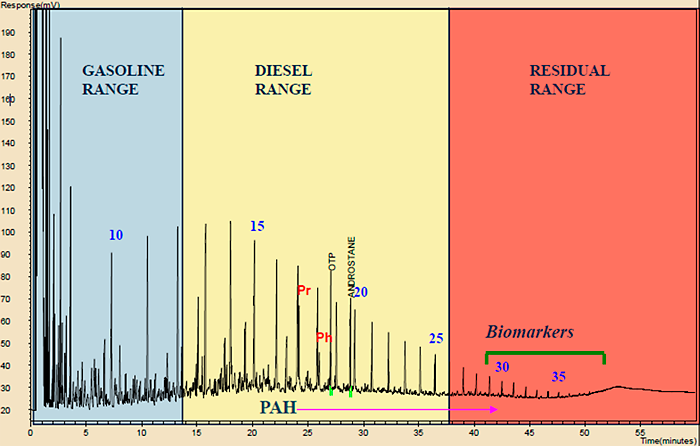
Figure A5-1. Chromatogram of a crude oil. Due to the nonspecific nature of the TPH analysis, TPH chromatograms should be routinely reviewed as part of the QA/QC process before TPH analytical results are used for decision making and if one ever receives questionable TPH results from the laboratory, one of the first actions should be a review of the chromatograms.
(Source: Modified after Chevron, ETC, OT&S, 2018.)
What Can Chromatograms Tell You?
Reviewing chromatograms is useful for reducing uncertainties inherent to TPH analysis. Although individual compounds frequently cannot be identified using the low-resolution GC methods or with nonselective detectors due to the large number of isomers, other valuable information can be obtained, including:
- type of material
- weathering
- presence of nonhydrocarbons
- presence of solvents and other interferents
- poor integration, which can lead to biased TPH concentrations (see Section 4)
- presence of nondissolved compounds.
Figure A5-2 shows typical chromatograms of a crude oil and common products. Because the x-axis is the same for the common products chromatograms, one can directly compare the elution times between the chromatograms. As expected due to the carbon ranges for each of the products, the elution times for the products increases from gasoline to jet to diesel. Crude oil spans the entire carbon range.
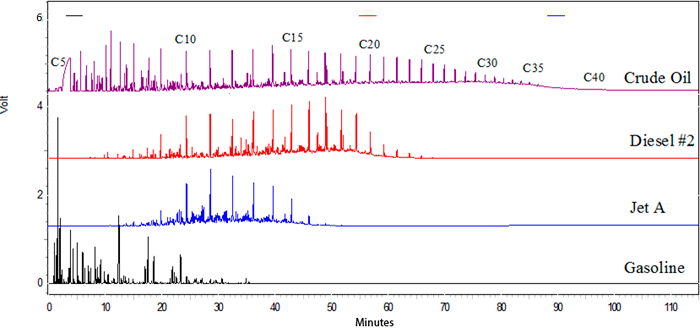
Figure A5-2. Typical chromatograms of a crude oil and common products. Note: The x-axis is the same for all chromatograms.
(Source: Chevron, ETC, OT&S, 2018.)
The chromatographic profile changes with environmental weathering of petroleum mixtures, but in predictable ways. Biodegradation can alter the relative distribution of hydrocarbons. In general, under aerobic conditions, n-alkanes are relatively easy to biodegrade. In most crude oils and middle distillates like diesel, n-alkanes are the most predominant features, as shown by the asterisks on the upper chromatogram of Figure A5-3 (Rhodes 2017). Biodegradation is evident in the bottom chromatogram in Figure A5-3 by the depletion of n-alkanes and the visible residual isoprenoids or highly branched alkanes. The “hump” or unresolved complex mixture (UCM) is largely composed of branched alkanes, cycloalkanes, and naphthene-aromatics. These types of chromatograms are useful in assessing the degree of weathering and in monitoring remediation progress. A good indicator of anaerobic degradation is the loss of toluene and relative increase of ethylbenzene in relation to xylenes with no significant loss of volatiles (Beller et al. 1995).
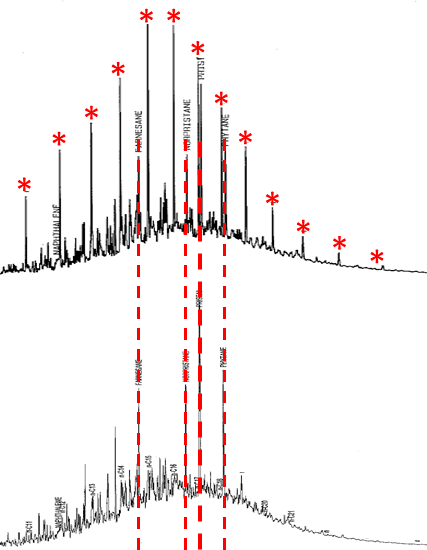
Figure A5-3. Highly branched alkanes remain after biodegradation
Figure A5-4 shows chromatograms of fresh gasolines and gasolines from monitoring wells. It illustrates the use of chromatographic profiles to assess degree and potentially types of weathering. Loss of volatiles is evident by relative reduction in the peaks from compounds lighter than toluene and the relative increase in later-eluting heavier compounds.
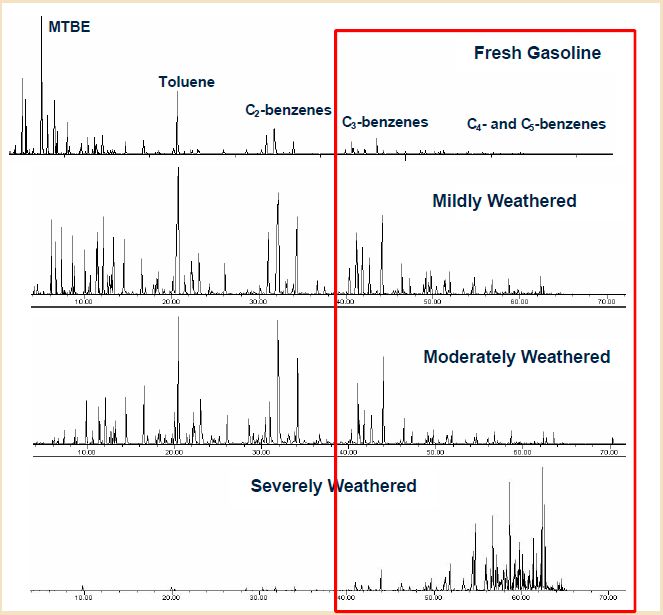
Figure A5-4. Distribution of compounds changes with weathering
(Source: Stout, S.A., Douglas, G.S., and Uhler, A.D., 2006.)
A review of chromatograms can also reveal the presence of nondissolved and polar nonhydrocarbons. The upper chromatogram in Figure A5-5 shows organic material extracted from a groundwater sample in the C15 and above carbon numbers. One would not expect to detect this carbon range as part of the water-soluble fraction due to the effective solubility of aromatic compounds with carbon numbers greater than 15 and aliphatic compounds less than C8. This indicates that either there is a nondissolved hydrocarbon component or there are nonhydrocarbons present. Silica gel cleanup can be used to determine if the “hump” is due to nondissolved hydrocarbons or polar nonhydrocarbons. In the bottom chromatogram of Figure A5-5 the removal of the “hump” and lowered TPH-d concentration indicate that the compounds were polar nonhydrocarbons instead of nondissolved hydrocarbons.
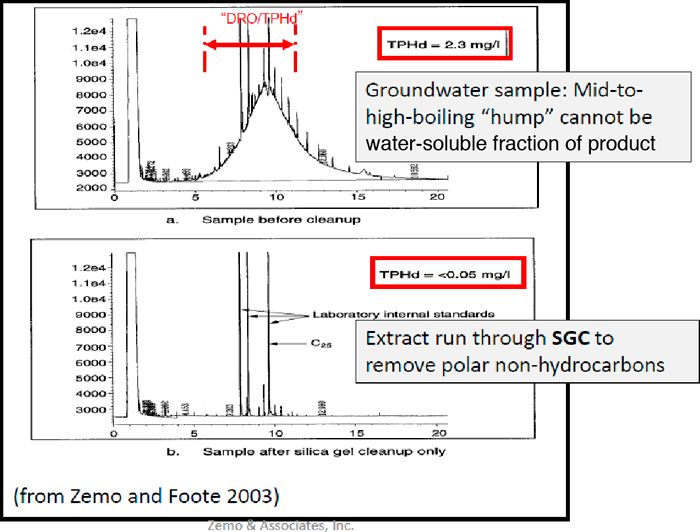
Figure A5-5. Example of biodegrading metabolites in groundwater within the TPH reporting range (Zemo 2016)
(Source: Zemo and Foote, 2003.)
There are many possible organic interferences that will appear in the TPH portion of the chromatogram. Two examples are shown in Figures A5-6 (solvents) and A5-7 (natural organics). The lower chromatogram in Figure A5-6 reveals that only four major compounds are responsible for the “TPH” concentration; however, none of these are petroleum hydrocarbons. Figure A5-7 demonstrates that natural organics can be difficult to differentiate from petroleum hydrocarbons, and in this instance, the spatial relationship to the presumed petroleum source area should be used as supplemental evidence as to the source of the organics.
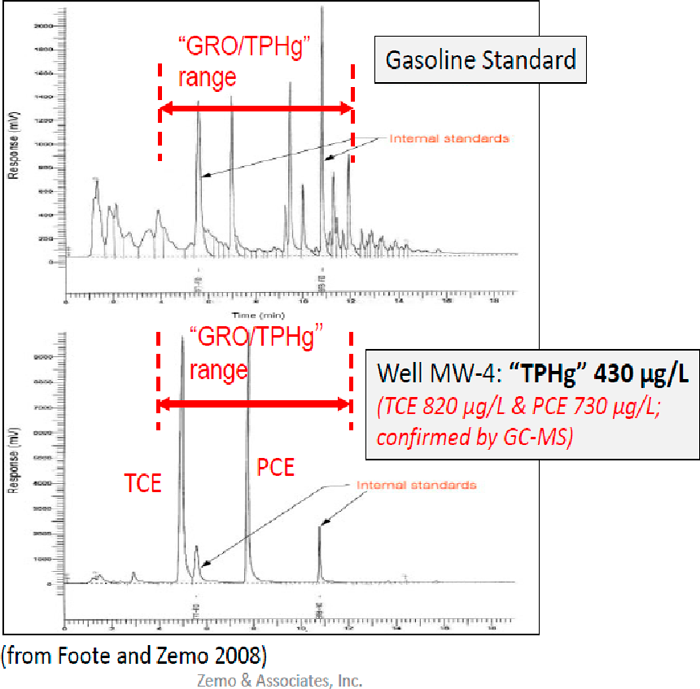
Figure A5-6. Example of CVOCs in groundwater within the GRO reporting range (Zemo 2016)
(Source: Foote and Zemo, 2008.)
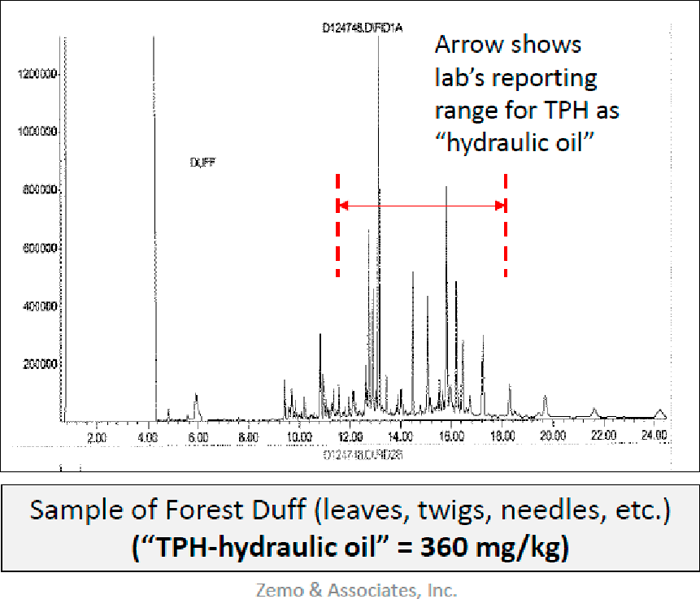
Figure A5-7. Example of natural organics (vegetative material) within TPH reporting range (Zemo 2016)
(Source: Zemo and Associates. 2018.)
A.6 TPH Fractionation Methods
View A.6 TPH Fractionation Methods in Adobe PDF format
| TPH Fractionation Methods Fact Sheet | ||||
|---|---|---|---|---|
| What Is TPH Fractionation? | Partitioning of the TPH mixture into aliphatic and aromatic fractions | |||
| Fractions can be further separated by equivalent carbon ranges | ||||
| Why Fractionate? | For risk assessment purposes because different classes of compounds have different fate, transport, and toxicity characteristics | |||
| To provide data for a refined risk assessment and to decrease uncertainty | ||||
| Most useful for soils and water, not typically done for air samples | ||||
| Trade-offs of Fractionation | ||||
| More manual steps than bulk TPH | ||||
| Fractionation is not perfect (potential loss of material through additional sample preparation or different extraction medium; see Section 4.2.5, Limitations of Fractionation Approach) | ||||
| Nonhydrocarbons are retained on silica gel and will not be detected | ||||
| Cost will be higher | ||||
| Comparison of TPH Fractionation Methods | ||||
| Evaluation Parameter | TX1005/TX1006 | WADOE VPH/EPH | MassDEP VPH/EPH | Implications/Biases |
| Motivation/Evolution of Method | Characterization methods for petroleum and petroleum products in the exploration, refining, and blending processes, and those were deemed to be best for these types of mixtures. | Split into volatiles/purgeables and semivolatiles/extractables; adaptation from 8021/8260 and 8270-type methods.
8270 is a method for phenolics, aromatics including PAHs, phthalates, organochlorine compounds, etc., and a wide-range solubility solvent was used for extraction. |
Split into volatiles/purgeables and semivolatiles/extractables; adaptation from 8021/8260 and 8270-type methods.
8270 is a method for phenolics, aromatics including PAHs, phthalates, organochlorine compounds, etc., and a wide-range solubility solvent was used for extraction. |
Methods developed for looking at many different types of compounds at low levels in soil and groundwater were simply used to develop methods for mixtures of hydrocarbons for VPH/EPH methods and not necessarily focused on hydrocarbons alone.
TX1005 method is currently being revised; TX1006 method is in draft form. NOTE: TPH is a method-defined parameter. |
| Number of Carbon Ranges Quantified and Reported | 13 specified ranges: C6 aliphatics, >C6–C8 aliphatics, >C7–C8 aromatics, and five ranges covering >C8–C35 for both aliphatics and aromatics TPHCWG method and TX can report for each individual equivalent carbon range and the user can add whatever ranges they choose. Because TX has its tox ranges, the method was written to serve the TX Risk Reduction program. TPH is defined by this method in that program. |
VPH: C5–C12 saturates and aromatics; EPH: 3–6 equivalent carbon ranges over C8–C36 | VPH: 2 aliphatic and 1 aromatic carbon ranges over C5–C12
EPH: 2 aliphatic and 1 aromatic carbon ranges over C9–C36. |
Carbon ranges can easily be modified upon request. The use of different analytical methods for volatiles and extractables will result in carbon number overlap. |
| Cost | About 2–5x the cost of USEPA method 8015 | About 2–5x the cost of USEPA method 8015 | About 2–5x the cost of USEPA method 8015 | |


