• Skip to main content
itrc_logo

TPH Risk Evaluation at Petroleum-Contaminated Sites

Navigating this Website
1 Overview
2 Introduction
2 Introduction Overview
2.1 Issues Unique to TPH
2.2 Applicability of Guidance
2.3 Background of Current Approaches
2.4 TPH Risk Characterization Framework
3 Regulatory Framework
3 Regulatory Framework Overview
3.1 History of TPH Regulation
3.2 What is the Legal Basis for Risk-Based Closure of Petroleum Sites?
3.3 TPH-Specific Regulatory Challenges
3.4 TPH-Specific Regulatory Tools
4 TPH Fundamentals
4 TPH Fundamentals Overview
4.1 Petroleum Chemistry and Refining
4.2 Physical and Chemical Properties of Petroleum Constituents, TPH Carbon Ranges (Fractions), and Metabolites
4.3 Properties of Aliphatic and Aromatic Hydrocarbon Fractions
4.4 Alterations of Petroleum Mixtures in the Environment Through Weathering Processes
4.5 Definition of “TPH” in Environmental Media in Risk Assessment
5 Conceptual Site Models
5 Conceptual Site Models Overview
5.1 Source Identification (Qualitative CSM)
5.2 Source Area Characterization, Extent, Distribution (Source Definition)
5.3 Fate, Transport, and Attenuation Mechanisms (Pathway Definition)
5.4 Points of Exposure (Receptor Definition)
5.5 TPH Target Levels
5.6 Compiling a CSM
5.7 TPH Data Collection Plan
5.8 Field Sampling Methods and Handling Procedures
5.9 TPH Analytical Methods
5.10 Silica Gel Cleanup Method
5.11 Reporting, Data Qualification, and Chromatograms
5.12 Data Usability, Interpretation, and Implications
6 Human Health Risk
6 Human Health Risk Overview
6.1 Introduction
6.2 Exposure Assessment
6.3 Direct Contact with TPH
6.4 Soil to Ambient Air Exposure to TPH (Volatiles and Particulates)
6.5 Leaching from Soil to Groundwater
6.6 Exposure to Groundwater/Surface Water
6.7 Exposure to Air
6.8 Food Chain
6.9 Toxicity Assessment
6.10 Evaluating Toxicity of Polar Metabolites
6.11 Toxicity Considerations for Different Exposure Rates
6.12 Risk Characterization
7 Ecological Risk Assessment
7 Ecological Risk Assessment Overview
7.1 ERA Process for TPH
7.2 Current National and North American TPH ERA Practice
7.3 Exposure Assessment
7.4 Toxicity Assessment
7.5 Risk Characterization
8 Risk Calculators
8 Risk Calculators Overview
8.1 Calculating TPH Risk
8.2 Electronic TPH Risk Calculators
9 TPH Special Considerations
9 TPH Special Considerations Overview
9.1 Special Factors
9.2 Emergency Conditions
9.3 Worker Exposure and Safety
9.4 Managing Open and Reopened TPH-Contaminated Sites
9.5 Estimating TPH Fractions
9.6 Managing the Presence of TPH Breakdown Products/Metabolites
9.7 Remedial Action and Institutional Controls
9.8 Common Mistakes and Lessons Learned
10 Stakeholder Concerns
10 Stakeholder Concerns Overview
10.1 Community Engagement Plans
10.2 Tools for Effective Community Engagement
10.3 Risk Communication
10.4 Communicating Risk Associated with TPH
10.5 VOCs in Commonly Used Products
10.6 Public Notification of Sampling
10.7 TPH Concepts Explained
11 TPH Risk Case Studies
Additional Information
Appendix A. Fact Sheets
A.1 Definition of TPH—Don’t Let the Name Fool You
A.2 TPH Analytical Methods
A.3 Silica Gel Cleanup (SGC)
A.4 Chemistry of Weathering Processes
A.5 Chromatograms: A Wealth of Information
A.6 TPH Fractionation Methods
Appendix B. Risk Evaluation Reference Tool
Appendix C. States Survey
Appendix D. Field Screening Methods
Acronyms
Glossary
Acknowledgments
Team Contacts
Document Feedback


TPH Risk Evaluation at Petroleum-Contaminated Sites
HOME

5 Conceptual Site Models and Investigative Strategies

This section provides guidance to create a conceptual site model (CSM) that specifically accounts for the unique properties of TPH, allowing for a more complete understanding of the fate and transport and exposure pathways required to assess TPH risk.

Recognizing that TPH is made up of many hundreds to thousands of individual compounds that can change composition both spatially and temporally over time and may result in some risk requires an investigative strategy that considers TPH properties. Because TPH can be present at a site in a variety of forms (NAPL, dissolved, volatilized, etc.) and in a variety of media (soil, water, air), it is essential for a practitioner to understand how the TPH analytical methods vary, and when to apply them. The CSM topic will discuss various TPH analytical methods and what the results mean for both characterizing the toxicity of TPH and evaluating the degree of potential exposure to human and ecological receptors.

A CSM shows the relationship in three dimensions between contaminant sources and receptors through potential or actual migration and exposure pathways. A CSM at a site contaminated with petroleum must account for the unique properties of TPH (see TPH Fundamentals) and include an understanding of the fate and transport mechanisms that will dictate the potential exposure of receptors to TPH. The CSM should be maintained and updated as new information is collected throughout the life cycle of a project. Various styles of CSMs are useful, from text explanations to a series of figures depicting current and predicted future site conditions. A form of visualization (e.g., figures, graphs, charts, tables) that relates site conditions to receptors in a manner that lends itself to explanation of TPH data is suggested (Figure 5-1 provides an example).

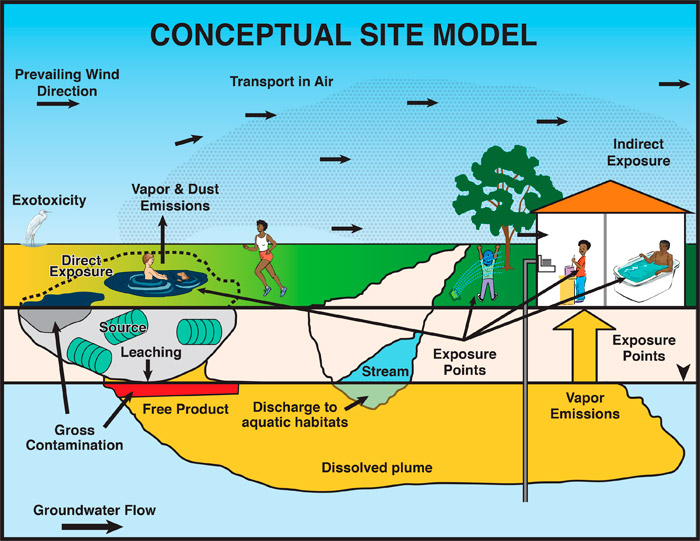
Figure 5‑1. Conceptual site model (visual depiction) showing the migration pathways of petroleum from source to receptors.

▼Read more

Information on the development of CSMs is readily available in a number of guidance documents including the following:

  • ITRC Triad Implementation Guide, ITRC SCM-3, 2007 ITRC 2007
  • Guidance for Conducting Remedial Investigations and Feasibility Studies Under CERCLA USEPA 1992
  • Data Quality Objectives Process for Hazardous Waste Site Investigations: Final Guidance USEPA 2000b
  • Standard Guide for Developing Conceptual Site Models for Contaminated Sites ASTM 2014a
  • Environmental Cleanup Best Management Practices: Effective Use of the Project Life Cycle Conceptual Site Model USEPA 2011

TPH is made up of many hundreds to thousands of individual compounds that can change composition both spatially and temporally; therefore, it is necessary to use an investigative strategy that is considerate of TPH properties. TPH can be identified at a site in a variety of media (soil, water, air), can be measured in LNAPL, and it is essential for a practitioner to understand how the TPH analytical methods vary, and when to apply them. Furthermore, a successful risk assessment is dependent on an iterative and frequently updated CSM.

TPH has specific physical, chemical, and biological behaviors that need to be considered while developing a quantitative CSM, and therefore, those unique aspects of TPH will also need to be considered in the investigative strategy. Understanding petroleum hydrocarbon chemistry, and how that chemistry affects the fate and transport in the environment, is essential. If any data are missing from the CSM, the investigative strategy should focus on filling those data gaps using the appropriate sampling methods, handling procedures, data quality objectives, laboratory and field analyses, and evaluation and reporting of results. In general, myriad decisions need to be made on the quantity of data and the spatial distribution of data collection, what samples to collect from various media using appropriate field tools, and which analytical methods to use. Therefore, any sampling and analysis related to petroleum contamination should be discussed with a hydrogeologist and risk assessor prior to preparing a TPH data collection work plan to ensure that the appropriate data for conducting the TPH risk assessment is available. Sampling locations, sample density, and other basic assessment considerations should also consider guidance from ITRC, EPA, state, and other resources.

Some of the fundamental aspects of a CSM that also apply to evaluating the risk of TPH are listed below, following the typical source-pathway-receptor conceptual model shown in Table 5-1. This template can be applied in developing a site-specific conceptual site model by indicating site-specific conditions ( yes;   no) as observed.

Other considerations (site and surrounding history, current and future land use, geology, hydrology, climate, etc.) are also important in the development of a CSM; these are covered in the prior-listed CSM references.

  • Source identification (Qualitative CSM)—Identifying the type of petroleum released to the environment, adjusting TPH methods to reflect the petroleum type, identifying mixes/comingled petroleum releases using TPH analyses.
  • Source area characterization, extent, distribution (Source definition)—Identifying the source of the release, areas of storage and transport, and alternate transformation phase (dissolved, gaseous states) of TPH. Identifying vadose zone, smear zone, and submerged contamination, total contaminant mass, and determining the extent of the contamination.
  • Fate, transport, and attenuation mechanisms (Pathway definition)—Determining the relative influences of transport and transformation processes on potential TPH exposure pathways, considering the potential changing composition of TPH over time and space.
  • Points of exposure (Receptor definition)—Identifying impacted and potentially impacted points of exposure and determining whether the composition of the TPH contamination poses a risk to receptors.
  • TPH target levels—Defining the extents of TPH delineation and setting risk-based remedial goals. Remediating to published screening levels may be no more protective than remediating to calculated target levels for TPH at the source and near receptors. Using TPH data to demonstrate remediation.
  • Identifying data gaps—Using indicator compounds only for an assessment or risk evaluation may leave data gaps in the CSM that can be filled with TPH data.

Table 5‑1. Conceptual site model (checklist/tabular depiction) relating petroleum sources to potential receptors through relevant pathways.

RELEASE LOCATION—Petroleum Oil Spill/Release from Containment
☐ Product storage   ☐ Pipeline/Flow Line   ☐ Operations   ☐ Waste Management Units
☐ Drainage Channels and Impoundments   ☐ Other/Unknown
☐ MOBILE NAPL SOURCE—Flowable Petroleum Oil (ITRC LNAPL Update Guidance)
☐ LAND SURFACE
☐ Flow and pooling of oil at ground surface
TRANSPORT BY OVERLAND FLOW (GRAVITY-DRIVEN)
☐ Lateral terrain-directed migration of oil
☐ Lateral migration of oil carried by surface water flow (rainwater or seasonal water flow)
☐ Lateral migration of oil during tidal water cycling
TRANSFORMATION BY VOLATILIZATION
☐ Vapor evolution from oil at ground surface
HUMAN RECEPTOR PATHWAYS
☐ Contact exposure to oil at ground surface
☐ Inhalation of vapors from oil
POTENTIAL ECOLOGICAL RECEPTORS
☐ Terrestrial vegetation (herbs/grasses)
☐ Reptiles and amphibians
☐ Terrestrial invertebrates (earthworms and insects)
☐ Wildlife (birds and mammals)
SURFACE WATER/SEDIMENT
☐ Nonflowing surface water (ponds, lakes, etc.)
☐ Continuously flowing surface water (streams, rivers, etc.)
☐ Tidally influenced surface water
☐ Seasonally present (ephemeral) surface water
☐ Freshwater
☐ Brackish
☐ Saltwater
TRANSPORT BY ADVECTION/DISPERSION (WATER-DRIVEN FLOW)
☐ Movement of oil or sheens on surface water
HUMAN RECEPTOR PATHWAYS
☐ Contact exposure to oil in water/sediments
☐ Contact exposure to oil on plants
POTENTIAL ECOLOGICAL RECEPTORS
☐ Aquatic vegetation (marsh grasses; mangroves)
☐ Reptiles and amphibians
☐ Aquatic invertebrates and fish
☐ Wildlife (birds and mammals)
UNSATURATED SUBSURFACE SOIL
☐ Vertical migration of oil between land surface and the water table
TRANSPORT BY GRAVITY-DRIVEN FLOW
☐ See page of oil into unsaturated soils
TRANSPORT BY WATER-DRIVEN FLOW
☐ Smearing of oil through downward rainwater infiltration
☐ Smearing of oil at the water table interface into unsaturated soil due to transient vertical fluctuations
HUMAN RECEPTOR PATHWAYS
☐ Contact exposure to oil in soils
ECOLOGICAL RECEPTORS
☐ Not applicable to vegetation unless oil at the surface or in the root zone; see Land Surface
☐ Burrowing animals
GROUNDWATER SATURATED ZONE
☐ Lateral migration of oil at the water table interface
TRANSPORT BY GROUNDWATER-DRIVEN FLOW
☐ Smearing and submerging of oil at the water table interface due to transient vertical fluctuations
☐ Lateral migration of oil at the water table due to transient vertical fluctuations and lateral gradients
HUMAN RECEPTOR PATHWAYS
☐ Contact/ingestion exposure to oil in abstracted groundwater (wells screened at the water table)
ECOLOGICAL RECEPTORS
☐ Not applicable unless oil is in root zone; see Land Surface
☐ RESIDUAL NAPL SOURCE—Immobile NAPL Trapped in or on Solid Media
SURFACE SOIL
☐ Residual oil (likely weathered, lower concentrations) on soil
TRANSPORT BY DIRECT EXPOSURE
☐ No transport driver
HUMAN RECEPTOR PATHWAYS
☐ Contact, incidental ingestion, and inhalation exposure to residual oil in shallow soils
☐ Agricultural crops—ingestion of root vegetables
ECOLOGICAL RECEPTORS
☐ Impacted vegetation (dead, stressed)
☐ Degraded soil quality (oil-crusted soils)
UNSATURATED SUBSURFACE SOIL
☐ Residual oil (may be weathered, lower concentrations) in soil
TRANSFORMATION BY VOLATILIZATION
☐ Vapor evolution from impacted subsurface soils
TRANSFORMATION BY DISSOLUTION (WATER-DRIVEN FLOW)
☐ Downward migration of water-soluble oil components due to rainwater infiltration
HUMAN RECEPTOR PATHWAYS
☐ Inhalation exposure to vapors
ECOLOGICAL RECEPTORS
☐ Burrowing animals
SUBSURFACE SOIL AT WATER TABLE
☐ Residual oil (may be weathered, lower concentrations) at the water table interface
TRANSFORMATION BY DISSOLUTION (WATER-DRIVEN FLOW)
☐ Dissolution of water-soluble oil components into water
☐ Lateral transport of water-soluble oil components as a groundwater plume
HUMAN RECEPTOR PATHWAYS
☐ Contact and ingestion exposure to soluble oil constituents in abstracted groundwater (shallow water wells only; freshwater only)
☐ Contact exposure with subsurface soils during excavation
ECOLOGICAL RECEPTORS
☐ Not applicable unless oil is in root zone; see Surface Soil
SEDIMENT AND HYPORHEIC ZONE
☐ Residual oil (may be weathered, lower concentrations) in sediment
TRANSFORMATION BY DISSOLUTION
☐ Dissolution of water-soluble oil components into water
HUMAN RECEPTOR PATHWAYS
☐ Contact exposure to sediments
☐ Fish consumption
ECOLOGICAL RECEPTORS
☐ Impacted vegetation (dead, stressed)
☐ Impacted benthic organisms
☐ Reptiles and amphibians
☐ Fish and aquatic animals

5.1 Source Identification (Qualitative CSM)

Petroleum contamination can originate from a range of refined products, crude oils, and condensates. The initial indications of the type of petroleum released will include where the release occurred and from what kind of infrastructure or facility (see Table 5-1).

▼Read more

Although pipelines and aboveground storage tanks can carry/hold most forms of petroleum, underground storage tanks typically contain only refined petroleum products. These initial indications can also be supplemented through a review of historic documents (inventories, facility engineering/design reports, and release histories), interviews, or early assessment data collection. Knowing the type of petroleum is crucial to guide the investigative strategy that can be employed to refine a qualitative CSM to become quantitative (including understanding the compounds to sample for in a more detailed risk assessment).

5.2 Source Area Characterization, Extent, Distribution (Source Definition)

At the time of a release and shortly thereafter, TPH contamination will be in the form of a mobile, free-phase immiscible liquid (flowable petroleum oil) often referred to as mobile NAPL (nonaqueous phase liquid) CL:AIRE 2014; ITRC 2018. From there, the free liquid can migrate across land surfaces, to surface water, into the unsaturated soil zones, and/or down to the saturated soil zones (groundwater) through overland flow, advection, dispersion, water-driven flow, and/or groundwater-driven flow. These pathways are included in Table 5-1.

▼Read more

Potential maximum release volumes or rates vary with storage volumes or the nominal volume flows associated with facility operations. A finite release volume of petroleum will spread over time to impact a finite area and volume of porous soils and sediments (much as any spilled liquid on porous media expands to a finite wet area) before receding due to attenuation. A continuing release of NAPL will expand to impact a finite area and volume of soil or sediment. At the maximum extent of impact, the release rate and the attenuation rate (due to dissolution, volatilization, and degradation) are equal. Mobile NAPL might directly intercept receptors as NAPL.

Methods for characterizing and assessing the three-dimensional extent and distribution of NAPL in the subsurface are summarized in ITRC LNAPL-3 ITRC 2018. Delineating a NAPL source can include qualitative observations such as measuring NAPL presence in monitoring wells. In addition, collecting TPH data from different media is often the best method of determining the presence of petroleum contamination (ITRC LNAPL-2) ITRC 2009a. If the type of fuel released is unknown, “bulk” TPH analyses (e.g., EPA method 8015) in the area(s) most likely to be the source of the release (based on a qualitative CSM) is often sufficient as a starting point. However, it will not be helpful in determining the type of petroleum contamination present, the degree of weathering, the presence of bioattenuation, or much information on the toxicity of the contaminated media. Furthermore, TPH data can quantify and qualitatively illustrate a petroleum release better than relying on data about individual compounds or the typical indicator BTEX compounds. Indicator compounds, such as benzene, can be absent or otherwise below levels of potential concern in contaminated media, and this can result in underestimation of risk and contaminant mass.

▼Read more

TPH data collection, analyses, and interpretation are just parts of a CSM. Careful field screening, using light-induced fluorescence and/or membrane interface probe tools and an understanding of chromatograms will enhance the information gained from conducting “bulk” TPH analyses. Detections on the light-induced fluorescence monitor or detections above the calibrated baseline for membrane interface probe response can be used as a rough yes/no determination as to the presence of TPH contamination. Furthermore, if the nature of the release, other than the location, is unknown, assuming a 200-foot radius from the source can be a starting point for delineating the TPH impacts. This is based on studies of soluble plumes of hydrocarbon chemicals, predominantly BTEX chemicals in unconsolidated sediments where limited extents have been documented to be less than 200 feet in length API 1998; Connor et al. 2015.

The areal extent of a NAPL release can be initially characterized using qualitative observations and quantitative bulk TPH data. The areal extent can depend on the total mass released, local geology, surface water and groundwater flow patterns, and oil properties.

5.3 Fate, Transport, and Attenuation Mechanisms (Pathway Definition)

NAPL movement as a result of a release (see Table 5-1) depends on the hydrocarbon liquid bulk properties (viscosity, density, surface tension); soil properties (porosity, pore size distributions, connected pore spaces, moisture levels); and interface properties (surface tension, sorption, molecular forces). The fate, transport, and attenuation mechanisms for NAPL are discussed in more detail elsewhere Garg et al. 2017; ITRC 2009a, 2009b, 2018. A release of NAPL will transport through various mechanisms, including overland flow (gravity-driven), advection, dispersion, water-driven flow, and groundwater-driven flow.

▼Read more

When released to land, NAPL will generally seep downward into soil toward the water table due to gravity and pressure head. A residual trail of NAPL will remain in soil as the NAPL front descends. Lenses of low-permeability or wetter soils may induce some intermediate lateral NAPL migration. The fraction of mobile NAPL depletes as a portion is left behind as immobile residual chemical in the soil column in which the NAPL is descending. NAPL migration may be limited by this depletion, or by physical barriers such as low permeability layers. Thus, smaller or more viscous hydrocarbon releases may be completely trapped as residual in the unsaturated soil zone. Larger volume and less viscous releases may migrate to the water table and become submerged, trapped at the water table and capillary fringe interface. As the water table level rises and falls, the NAPL will begin to spread laterally and “smear” into the soil matrix due to a fluctuating water table.

Source zones of residual NAPL in soils and as mobile NAPL will weather and deplete over time due to dissolution, volatilization, and biodegradation (known as natural source zone depletion. These processes will result in the partitioning of TPH into various phases based on physical chemistry and deplete TPH constituents at varying rates. Therefore, the TPH composition of the NAPL will differ from the TPH composition in the dissolved and vapor phases. The maximum aqueous or vapor concentrations of the chemical constituents making up the TPH are much less than those of the pure chemicals and will be dictated by saturation limits and partitioning coefficients.

▼Read more

Furthermore, BTEX chemicals are fractionally soluble in water, have higher pure chemical solubility than other hydrocarbon chemicals, and, when present, are the dominant constituents in soluble groundwater contaminant plumes originating from petroleum hydrocarbons. Other petroleum constituents have lower pure chemical aqueous solubility and dissolved-phase mobility, and show less migration in groundwater than the BTEX chemicals. However, these other petroleum constituents may still be in the groundwater. Their suspected presence should be confirmed through sampling and analysis.

To have a robust CSM, you must further estimate how the TPH in all phases (NAPL, aqueous, and vapor) will vary both spatially and temporally. Over time, TPH constituents in soil moisture can migrate by capillary action, gravity, and infiltrating rainwater and potentially leach into groundwater. For sites where NAPL has reached the water table, TPH constituents may dissolve directly into the groundwater and migrate with the groundwater flow, creating a TPH plume. However, based on the physical chemistry of the TPH and the saturated soil environment, a TPH plume may have retarded migration compared to the groundwater itself. Similarly, NAPL that has affected surface water may dissolve and transport TPH constituents farther downgradient, depending on the flow and water chemistry characteristics of the surface water body. For vapors, TPH constituents may migrate through air-connected soil pores to the ground surface and into breathing zones both in indoor and outdoor air ITRC 2014; USEPA 2015a. Most chemical constituents degrade and attenuate with increasing distance from the original release location. In addition to measuring petroleum hydrocarbons in the environment, the presence of degradation byproducts (also called metabolites, polar intermediates) can be evidence of ongoing transformation processes.

▼Read more

Most soluble hydrocarbon plumes in unconsolidated sediments are less than 200 feet in length measured from the downgradient edge of the NAPL plume, and stable or shrinking in extent. In terms of the time duration, studies of soluble petroleum plumes have been shown API 2012; McHugh et al. 2014 to be of limited extent with a median half-life for benzene of approximately 3.9 years due to source zone depletion. Groundwater contaminants in fractured bedrock or karst or in aquifers with high seepage velocities (> 10 cm day-1 to 1 m day-1) may migrate farther distances than the nominal 200-foot plume length for BTEX API 1998; Connor et al. 2015. This should be considered when developing your investigative strategy.

Degradation and transformation of petroleum hydrocarbon constituents in the environment is widely reported Zobell 1946; Atlas 1981; Leahy and Colwell 1990 and recognized under aerobic conditions, in the presence of other external electron acceptors (nitrate, manganese, ferric iron, sulfate, carbon dioxide), and in fermentative/methanogenic conditions. With O2 present, the degradation of all gasoline range hydrocarbon constituents has been reported Prince, Parkerton, and Lee 2007. These may readily degrade to CO2 and H2O in a water-soluble phase. Similar results are reported Prince et al. 2013 for crude oil, with the exception of hopanes as a class. However, hopanes are not unique to crude oil but are present as components in bacterial cell membranes, and, as such, are known to be ubiquitous in the environment. Table 5-2 summarizes the relevant biodegradation processes for TPH in different media.

Table 5‑2. Transformation processes (aerobic, anaerobic, fermentative/methanogenic) for typical compositions of TPH found in impacted media

Soil, Waste, NAPL Typical Composition Up to C32 for systemic toxicity evaluation (>C32 has limited bioavailability)

TPH for gross toxicity/exposure

Aerobic Kinetic rate may be nutrient- (nitrogen, phosphorus, potassium [N, P, K]) or biomass growth–limited due to excess carbon; transport-limited (oil and electron acceptor mixing and diffusion rates)
Anaerobic Kinetic rate may be biomass growth–limited due to excess carbon; transport-limited (oil and electron acceptor mixing and diffusion rates)
Fermentative/

Methanogenic

Fermentation and degradation to methane (CH4) and carbon dioxide (CO2)

May include gas ebullition (bubbling)

Selected intermediate products may persist in highly reduced conditions

In low-mixing environments these intermediate products may accumulate

Discussion/

Complications

Oil composition changes over time as volatile and water-soluble components are depleted and amenable components are degraded

Media/phase may include mobile or residual (immobile) NAPL trapped by capillary forces within the soil matrix

Unrefined petroleum (crude, condensate) may include heterogeneous organic chemicals (containing S, N, O)

Aqueous Phase Typical Composition Predominantly light aromatic hydrocarbons

Benzene, toluene, ethylbenzene, xylenes

Include hydrocarbons with pure chemical aqueous solubility >1 mg/L, such as ≤C7 n-alkanes, <C8 branched alkanes (selected), ≤C12 alkylbenzenes, ≤C13 alkyl-naphthalenes, and ≤C14 polycyclic aromatic hydrocarbons

Aerobic Observed rate and/or aerobic zone extent is most often oxygen diffusion–limited in groundwater

In well-mixed surface water, can be nutrient-limited (P)

Anaerobic Water-soluble dissolved phase may degrade readily relative to diffusion or advective transport rates in groundwater

Observed rate may be electron acceptor diffusion–limited

Fermentative/

Methanogenic

Selected intermediate fermentation products may persist in highly reduced conditions
Discussion/

Complications

Media/phase may include hydrosols (oil-in-water) or suspended sediments with sorbed chemicals depending on the amount of mixing and the sampling method
Soil Gas Typical Composition Predominately light volatile hydrocarbons

Include chemicals with pure chemical vapor pressures ≥ 0.008 mmHg or (equivalently) normal boiling points ≤ 270°C, such as ≤C15 n-alkanes and ≤C13 alkylbenzenes and naphtheno-benzenes

Aerobic Aerobic zone extent may be oxygen diffusion–limited

Degradation may be kinetically limited for short transport distances or brief soil residence times

Observed attenuation distance of aromatics is slightly less than aliphatics

Anaerobic Transport of nongaseous electron acceptors is limited in the vadose zone

Nitrate may be transported from the shallow surface by water infiltration

Fermentative/

Methanogenic

Much slower to no direct observed degradation of hydrocarbon vapors or methane under highly reduced methanogenic conditions
Discussion/

Complications

Ambient air may include significant non-source-related “background”; therefore, background soil gas sampling may be needed to distinguish

Vapor sources may include methane (possibly advective) from adjacent methanogenic ebullition

5.4 Points of Exposure (Receptor Definition)

Human and ecological receptors may be exposed to TPH through different environmental media (soil, water, air) and through different routes of uptake (direct contact/absorption, ingestion, inhalation). These points of exposure (human receptor pathways and ecological receptor types) are also summarized in Table 5-1 for the different media. Human exposure pathways are usually associated with the mode of uptake, while ecological receptors include vegetation, invertebrates, benthic organisms, amphibians/reptiles, fish, birds, and other animals.

▼Read more

In terms of pathway-specific evaluations, surface soils, subsurface soils, and saturated soil and sediment can be directly impacted with NAPL (residual) or indirectly impacted with TPH dissolved in soil moisture. Soil exposure pathways mainly include direct contact by receptors, including humans, plants, plant roots, and burrowing animals. Migration of TPH contamination in groundwater, and the leaching or dissolution of TPH into groundwater, are potential groundwater risks, and ultimately, groundwater exposure can occur via ingestion. Similarly, NAPL advection/dispersion on surface water, and the dissolution of TPH into the surface water, are potential risks to human and ecological receptors (aquatic vegetation, fish, benthic organisms, amphibians/reptiles) through direct contact and ingestion pathways.

For potential inhalation exposures, burrowing animals can be at risk to volatile TPH in soil gas. Likewise, the transport of soil gas or direct volatilization of vapors from NAPL or dissolved TPH into the breathing zone or indoor structures can be other inhalation exposure pathways to consider in a risk assessment. Comprehensive guidance is available USEPA 2015c; ITRC 2014 on risk evaluation of hydrocarbon vapors from subsurface petroleum sources to indoor air. The guidance highlights the significant and extensive attenuation of hydrocarbon vapors over short distances in aerobic soils due to biodegradation.

5.5 TPH Target Levels

Human and ecological target levels are usually set based on the local regulatory jurisdiction (see Regulatory Framework). Different TPH ranges (e.g., gasoline, diesel, oil) or fractions based on carbon number may have established target levels for some or all different types of media and relevant exposure pathways (see Risk Calculators). The relevance of media and exposure routes varies (spatially and temporally) for different compositions of TPH. Thus, site-specific target concentrations for TPH constituents might also need to be established and used in developing the CSM. The specific target levels established for TPH should be pathway-specific.

TPH target levels would be used to help delineate the extents of TPH contamination in the different media.

▼Read more

Risk-based concentration criteria for different land uses, such as residential or commercial/industrial, and for each relevant environmental media (soil, groundwater, air) may be developed and often include significant conservative factors of safety. These criteria are applicable only when the exposure route is present (direct contact, ingestion, inhalation) now and in the future and complete from the contaminant source to the point of exposure (i.e., there is a complete source-pathway-receptor linkage). Although there may be no risk, there may still be regulatory requirements to fulfill (see Tiered TPH risk assessment framework).

The uptake concentrations of TPH in vegetables and fish are extrapolations of the measured uptake of identifiable and confirmable chemicals. The only method to confirm exposure in relation to TPH target levels is through sampling and analyses. (See Sections 6.8.3 and 6.11 for more information.)

When TPH targets are established for a site and incorporated into the CSM to delineate the zones of contamination, an immediate risk evaluation can be conducted by simply showing that concentrations at the point of exposure are below target levels. Alternatively, exclusion distances or criteria can be applied to potential receptors as being at risk. For evaluating potential ecological exposures, some approaches rely on concentration-based screening criteria for specific media. For actual spills and releases, there is the additional option of evaluating a site based on observed ecological impacts relative to a nearby control site.

▼Read more

Exclusion distances may be applied specifically for the petroleum vapor intrusion pathway USEPA 2015c; ITRC 2014; Lahvis 2017. The distances defined in these guidance documents incorporate the protective aerobic biodegradation zone between the source (NAPL or dissolved petroleum plume) and the indoor structure to mitigate any risks of petroleum vapors. Similarly, exclusion criteria can be applied to determine if an ecological assessment is warranted. As outlined in ASTM E2205 2014b, ecological assessments can be excluded based on a series of conditional questions summarized in Table 5-3. However, exclusion distances have not been adopted by all state agencies. In such cases, screening should follow local regulatory requirements.

Table 5‑3. Representative exclusion criteria for ecological risk assessment
(Source: ASTM E2205,2014.)

Question Yes is the answer No is the answer
1 Is the release to surface waters or associated sediments and do natural communities routinely use surface water as valuable habitat? Exclusion criteria not met (for waters and sediments). Ecological risk assessment needed.

Also go to Question 2 (for soils).

Exclusion criteria met (for waters and sediments). Go to Question 2 (for soils).
2 Is the site wholly contained under impervious surfaces such as pavement? Exclusion criterion met (for soils). No ecological risk assessment needed. Exclusion criteria not met. Go to Question 3.
3 Is the contamination wholly contained under the plant root zone (below 1.5 m)? Exclusion criterion met. No ecological risk assessment needed. Exclusion criteria not met. Go to Question 4.
4 Does the contaminated land serve as habitat, foraging area, or refuge to threatened/endangered or other protected species? Exclusion criteria not met. Ecological risk assessment needed. Exclusion criterion met. Go to Question 5.
5 Does similar but unimpacted habitat exist within a 0.8 km radius of the contaminated property? Exclusion criteria not met. Ecological risk assessment needed. Exclusion criterion met. Go to Question 6.
6 Is the affected property within 0.4 km of sensitive wildlife areas (for example, rookeries, preserves, management areas)? Exclusion criteria not met. Ecological risk assessment needed. Exclusion criterion met. Go to Question 7.
7 Is the contamination areas less than de minimis acreage (0.4 to 0.8 hectare) and expected to remain so? De minimis exclusion criteria met. Ecological risk assessment not needed. De minimis exclusion criteria not met. Ecological risk assessment needed.

5.6 Compiling a CSM

The investigative strategy should focus on filling data gaps in a CSM, whether that starts from a qualitative CSM or refining or expanding upon a quantitative CSM. The appropriate sampling methods, handling procedures, data quality objectives, laboratory and field analyses, and interpretation and reporting of results should be used. TPH has specific physical, chemical, and biological behaviors that need to be considered while developing a quantitative CSM, and therefore, those unique aspects of TPH will also need to be considered in the investigative strategy.

▼Read more

Understanding petroleum hydrocarbon chemistry and how that chemistry affects the fate and transport in the environment helps to define what data inputs are sufficient. Determining what and how much data are needed from the CSM to make decisions about risk specific to TPH can be difficult. Therefore, any sampling and analysis related to petroleum contamination should be discussed with a risk assessor prior to preparing a TPH data collection work plan to ensure that the appropriate data for conducting the TPH risk assessment are available.

In general, myriad decisions need to be made when compiling quantitative information on a CSM for a petroleum release site, including:

  • Decisions and planning on the quantity of data and the spatial distribution of TPH data collection
  • Determinations of what samples to collect from various media (including background samples) using appropriate field sampling tools and handling procedures
  • Identifying which TPH analytical methods to use and request from a laboratory

5.7 TPH Data Collection Plan

As with any site assessment, multiple lines of evidence should be considered in the TPH data collection plan, including any historic site uses, monitoring data, and remediation activities. The expected nature and extent of the TPH should be based on the CSM, including the various media suspected to be impacted, compositional phases, and any historic and ongoing physical, chemical, and biological properties affecting the TPH behaviors. The CSM should then be used to inform the investigative strategy, oftentimes in an iterative manner (e.g., an evolving CSM)). Using what is known about the fate and transport of petroleum compounds, the specific TPH data to be included in the investigation strategy were summarized in the typical compositions shown in Table 5-2.

In addition to the type of TPH data to be collected, a TPH data collection plan should include several other considerations that focus on the numbers and locations of samples needed for the risk assessment, as well as supporting data.

  • The amount of TPH data (defined by the number of sampling locations/depths and/or spatial density) to be collected should be sufficient, depending on how the data will be used. For more information see ITRC Geospatial Analysis guidance 2016a.
    • For developing a qualitative CSM where determining simple presence/absence of TPH or delineating contamination is the goal, fewer locations/low-density sampling or screening may be sufficient as an initial indication of the release boundaries.
    • For developing a quantitative CSM where characterizing fate and transport mechanisms affecting the TPH is the goal, more locations/higher density sampling may be required.
    • For conducting the hazard/risk assessment establishing exposure pathway connectivity, chemical toxicity thresholds, receptor characteristics, and any other data the risk assessor may need, specific locations relevant to exposure pathways may need higher density sampling and/or specific TPH parameters (fractions, indicator compounds, specific analytes) included.
  • Where and when preliminary screening data would be collected versus comprehensive data (e.g., as the CSM or risk assessment is refined)
  • The media (soil, sediment, soil gas, groundwater, surface water) in which samples should be collected and the sampling locations and density for that media
  • Supporting samples that should be collected in addition to the TPH data (e.g., background samples—all media, media-specific samples to determine fraction of organic carbon, pore saturation, geochemistry, natural attenuation parameters, fixed gases, toxicity testing, etc.). See Risk Calculators for information regarding what site-specific parameters are needed for each model
  • Presence, toxicity, and potential risks of daughter products of TPH degradation (polar metabolites)
  • Adequate sample volumes to collect, which should account for:
    • Method-specific sample volume requirements (e.g., bulk vs. fractionated TPH analyses; range of fractions; and separate aliphatics from aromatics)
    • Number and types of sample extractions needed (e.g., hexane, methanol, methylene chloride)
    • Analysis with or without the use of silica gel cleanup (SGC), or if both SGC and non-SGC data are needed, to account for TPH degradation products
    • Indicator or specific compounds (e.g., BTEX, PAHs, etc.) analyzed using different methods from TPH, or subtracted from the TPH results
  • Use of a biased or nonbiased sampling scheme (see Geospatial Analysis for Optimization at Environmental Sites (ITRC GRO)).

Ultimately, the TPH data collection plan should also be informed by the sample collection and handling methods, data quality objectives (DQOs), expected TPH analyses to be conducted on the samples, and how all of the data will be used and interpreted in the risk assessment (see Data Usability, Interpretation, and Implications). Each of these sections should be reviewed as part of developing the TPH data collection plan.

5.8 Field Sampling Methods and Handling Procedures

The sample collection method will be based on the specific media. Various field screening methods are available to provide an initial characterization of a petroleum release. These initial characterization approaches (see Field Screening Methods Factsheet) can be used to help refine a qualitative CSM to become more quantitative. Furthermore, these tools can be useful to help refine the investigative strategy, including the sampling methods, analytical selection, and interpretation of data.

For soil and sediment sampling, single grab, composite, or incremental sampling methodology (ISM) ITRC 2012 can be used, based on the project objectives. For groundwater, passive sampling or no/low-purge sampling should be considered to minimize sample turbidity ITRC 2006. Likewise, the use of bailers or specific pumps, as well as the appropriate use of sample filtering in the field, should be defined in the work plan. For soil gas vapors, passivated stainless-steel (e.g., Summa) canisters or sorbent tubes are recommended, depending on the TPH carbon ranges targeted ITRC 2014. In all cases, regardless of the media sampled, field observations collected during the sampling collection event should be noted in as much detail as possible, because many of the observed conditions help to refine subsequent analytical procedures and the interpretation of the analytical results in the TPH risk assessment. Different considerations are given for:

  • Sampling and handling soil and sediment
  • Sampling and handling groundwater or surface water
  • Sampling and handling soil gas vapors

5.8.1 Sampling and Handling Considerations for Soil and Sediment

▼Read more

Most of the contaminant mass is often found in soil in the saturated soil zone. The sampling plan should allow for collection of soil samples from the saturated soil, based on field screening and other observations.

The presence of organic materials (e.g., grass particles, algae, etc.) should be noted and minimized in the sample because these may cause interferences with TPH analyses. Likewise, physical characteristics of the sample (e.g., petroleum odor, colorations, and/or viscosities) should be noted. In particular, other odors such as solvent odors, rotten-egg odors, etc., help indicate different petroleum types in different regions, weathering and biological changes in the petroleum, or potential interferences (e.g., sulfur). Whenever these characteristics are encountered, the depth in the vadose or unsaturated zone and other descriptive characteristics (odors, staining) should also be noted in field logs. Contact between the soil or sediment samples and plastics or gloves should be minimized during the collection procedure, as these often contain organic materials that could interfere with TPH analyses.

Some plant or animal oils may show up as TPH if included in the samples submitted for testing. Any plant matter evident in the sample should be noted in the field notes.

Samples being submitted to the laboratory for volatiles analyses (i.e., BTEX or TPH fractions of ≤C12) should be immediately preserved in methanol or collected in airtight containers (e.g., EnCore samplers) to avoid volatilization of the constituents of concern. If compositing or mixing incremental samples in the field, ensure the procedures are in accordance with the methods described in ITRC ISM Section 5.4.2, where multiple incremental samples are preserved together in a large container of methanol, when possible, or as otherwise directed by the overseeing regulatory agency. Results for soils not collected in airtight containers or immediately field-preserved in methanol may be biased low due to volatilization and biodegradation of contaminants prior to laboratory extraction/preservation. This bias can be increased if methanol is not used by the laboratory due to the superior extraction efficiency of solvent extraction versus vapor partitioning Hewitt 1998. Soil and sediment intended to be used for field vapor screening should not be used for laboratory analysis of TPH due to volatile losses as well.

In terms of the sample volumes needed, ensure that minimum mass requirements are met if ISM samples are to be collected ITRC 2012. Otherwise, consult with the analytical laboratory to specify and provide sample containers (typically glass), preservatives, and shipping instructions needed for the expected TPH and indicator compound analyses (see TPH Analytical Methods).

When methanol is being considered as the preservative, detection limits should be sufficiently low to be below action/risk levels and used to determine if an additional sample needs to be collected for dry weight correction. Consult the DQOs set during the TPH data collection planning. Furthermore, the laboratory should be asked to provide methanol containing the appropriate surrogates for analysis rather than adding surrogates to the samples once they arrive at the laboratory (e.g., see Alaska GRO method AK101). This will allow for the evaluation of potential losses of analyte during the collection process and allows the surrogates to interact with the soil to estimate extraction efficiency. Note that the process of prespiking surrogates in methanol-preserved samples is a modification of some of the more commonly used methods (e.g., GRO, MassDEP VPH method).

5.8.2 Sampling and Handling Considerations for Groundwater and Surface Water

▼Read more

For water samples, every effort should be taken in the field to minimize excessive turbidity. Turbid samples will include petroleum hydrocarbons that are adhering to soil particles rather than the dissolved-phase TPH in the water. Excessive turbidity, as well as droplets of NAPL being introduced into the sample, is usually induced by turbulence during fast drawdowns in the groundwater and rapid recharge or in the surface water column. While it has been known for years that bailers produce turbid samples, methods are available for reducing turbidity in samples including “no-purge” sampling tools (e.g., the SNAP sampler or Hydrasleeve), low-flow purge and sampling, redeveloping monitoring wells, and using prepack screens and “well development” for open boring/direct push sampling.

Filtering of water samples is another option but should be discussed with the risk assessor and/or regulator beforehand. Filtering may be needed to remove droplets of LNAPL, sheens, colloids, or sediment particles from the water samples because relatively large differences in TPH analytical results from sample duplicates can be attributed to these heterogeneities. However, filtering may limit the representativeness of the water sample in the risk assessment context because receptors (e.g., direct human ingestion or ecological contact) would not generally encounter filtered water.

Although it may not be possible to entirely avoid turbidity, the observation should be documented along with the presence of any NAPL, discolorations, odors, natural organic materials (e.g., algae), etc. Each of these causes interferences in TPH analyses or provides TPH data that may be misrepresentative. In addition, the sampling location, depth, lithology, and additional field screening data such as dissolved oxygen, redox, pH, temperature, etc., should be properly documented to provide a comprehensive data package for the risk assessment.

Additional groundwater or surface water samples may also need to be taken to measure geochemistry, natural attenuation parameters, and/or the toxicity of TPH degradation products. If silica gel cleanup is to be included, sufficient sample volumes will need to be collected, and the appropriate sample containers, compatible sampling supplies, preservatives, and storage and shipping details planned in advance.

5.8.3 Sampling and Handling Considerations for Soil Gas Vapors

▼Read more

For sampling soil gas vapors for TPH, one of the main considerations is determining the appropriate type of sampling instrument to use depending on the carbon range of TPH to be targeted. Suitable containers for TPH soil gas samples include Tedlar bags, gas-tight vials (glass or stainless steel), sorbent tubes, and passivated stainless-steel canisters (Summa). Tedlar bags are generally not considered to be reliable for more than 48 hours, but some agencies may have different requirements ITRC 2014. Furthermore, different types of sample containers may be needed to cover the complete TPH carbon range desired. Specifically, Summa canisters should be used for carbon ranges <C12, while sorbent samples can be used to collect soil gases containing a wider range of carbon ranges (e.g., bulk gasoline and diesel range).

Another consideration for sampling soil gas vapors is the compounds used as tracer gases during leak check procedures. Certain tracer gas compounds (isobutane, isopropyl alcohol) have a direct impact on the quantitation of TPH if present at elevated concentrations greater than 0.01% by causing (1) false positives and (2) elevated reporting limits due to significant dilutions performed by the laboratory. Other tracer gas compounds such as 1,1-difluoroethane or sulfur hexafluoride may not cause false positives, but may lead to elevated reporting limits if also present at elevated concentrations. Helium is generally considered the least problematic tracer gas because it can be measured in the field and does not lead to either type of interference with TPH analyses. However, helium itself may have to be quantified in the sample using additional analysis at the laboratory. For additional information, see ITRC 2014.

5.9 TPH Analytical Methods

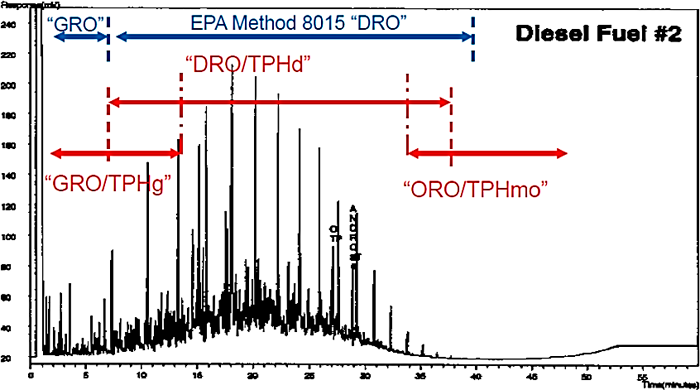
TPH is a method-defined parameter. Many different methods have been used, or are still being used today, to quantify TPH. There are a number of widely used technical references that contain summaries of the history and types of TPH analyses TPHCWG 1997a; ATSDR 1999; CASWB 2015; ITRC 2014; API 2001. A white paper was prepared for API regarding TPH analytical methods Zemo 2016 that includes the history of analyses, analytical methods currently in use, various technical aspects of the analysis and data interpretation, and other related topics. With different methods potentially in use, the results can be tremendously variable, providing different measurements of TPH, different definitions of what is included in TPH as a measurement, and how comparable TPH data are between sites or over time. The generalized quantitation method, type of data provided, advantages and limitations, and potential applications of generalized categories of TPH analyses are summarized in Table 5-4.

Table 5‑4. General information provided by the different categories of TPH analyses

TPH Method (Quantification) Boiling Point/Carbon Range Molecule Type Subject to Including Nonhydrocarbons QA/QC for SGC Option Chromatogram Potential Application
Bulk Gravimetric

EPA Method 1664A; Hexane Extractable Material (HEM) and Silica Gel-Treated HEM; SW846 9071*

No No Yes No No Not recommended for use except if required by regulatory agency (e.g., NPDES). Too little information is provided and no mechanism is available to evaluate results.
Bulk Infrared (IR)

ASTM D7066-04 2017

No No Yes No No Not recommended. Too little information is provided and no mechanism is available to evaluate results.
Bulk GC-Flame ionization detector (FID)

EPA Method 8015*-based; TPH- (purgeable and extractable)

TX 1005 (single pentane extraction)

Rough No Yes Yes, if using Method 3630C for SGC Yes Use for “total organics” analysis of bulk TPH-GRO only, because no cleanup is available.

Use for “total organics” analysis for bulk TPH unless SGC is used.

Use for determining the extent of impacts.

Bulk GC-MS

EPA Method 8260* (quantitated using response within selected boiling point range compared to product or individual hydrocarbon standard)

Missouri DNR MRBCA Guidance GC-MS TPH-DRO/ORO/RRO method according to EPA Method 8270*

Rough No Yes, unless manual subtraction is done No Yes Use for “total organics” analysis for bulk TPH-GRO unless manual subtraction is done.

Use for “total organics” analysis for bulk TPH-DRO/ORO/RRO, unless SGC is used.

Use for determining the extent of impacts.

Fractionated TPH by GC-PID (photoionization detector) and/or GC-FID

Washington State Dept. of Ecology (WADOE) or MassDEP VPH/EPH (purgeable and extractable)

TX 1006 (single pentane extraction)

Detailed Aliphatics, aromatics Less likely Yes Yes Use to obtain detailed fraction data for fate and transport calculations and/or human health risk assessments.

Representative samples can be analyzed to characterize nature of petroleum mixture.

Results will not include an estimation of polar compounds.

Bulk GC-FID for air-phase samples

TO-3 USEPA 1984

Rough No Yes NA Yes Use for “total organics” analysis for bulk TPH-GRO. FID does not provide total ion chromatograms.

Use for determining the extent of impacts.

Bulk GC-MS for air-phase samples

TO-15, TO-17

Rough No Yes, unless manual subtraction is done NA Yes Use for “total organics” analysis for bulk TPH-GRO unless manual subtractions are conducted.

Use for determining the extent of impacts.

Fractionated TPH by GC/MS for air-phase samples

MassDEP APH

Detailed Aliphatics, aromatics Yes, unless manual subtraction is done NA Yes Use to conduct a human health risk assessment.
Fractionated VPH by GC/MS

MassDEP VPH

Detailed Aliphatics, aromatics Yes, unless manual subtraction is done NA Yes Use to conduct a human health risk assessment.
*most current version

Note: Methods listed are intended to be examples of some commonly used methods. This is not an all-inclusive list of methods.

▼Read more

Considerations in selecting one or more analytical methods may include:

  • Project objectives
  • Regulatory requirements
  • Application (detection, delineation, monitoring, risk assessment, etc.)
  • Petroleum type, if known

Method selection includes specification of:

  • Extraction solvent(s)
  • Applied calibration standards
  • Carbon number reporting ranges

Potential issues may include:

  • Over- or under-representation of certain ranges/fractions or compounds
  • Applicable method boiling point/carbon number range relative to the sample range
  • Elevated reporting limits
  • Method interferences
  • Accuracy and precision

Multiple methods may be specified for different purposes at the same site. Consultation between the risk assessor, project manager, and analyst may be required.

In addition to TPH, individual compound analyses are typically required to assess risk at petroleum release sites. These could include BTEX, naphthalene, MTBE, tetraethyl lead, etc., and depend on the suspected product released (e.g., crude oil vs. gasoline vs. diesel, etc.). Appendix C—States Survey shows the general differences among the states for the requirements for TPH analyses, as well as requirements for individual compounds; this is based on the State Survey conducted by ITRC in 2017. Based on best practices, it is recommended that a combination of individual compounds and TPH analysis is necessary for conducting a risk assessment at petroleum release sites, but the list of compounds can be tailored to the type of petroleum released. Some common individual compound analyses and associated analytical methods are summarized in Table 5-5.

Table 5‑5. Recommended individual compounds and analytical method

Individual Compound(s) Method by Matrix Petroleum Type/Other Comments
Methane, oxygen, and carbon dioxide Groundwater (GW): RSK-175

Air: ASTM D1945 or EPA Method 3C

All petroleum types

Used to measure redox conditions and degradation indicators.

n-hexane Product, Soil, Water: EPA Method 8260*

Air: TO-15/TO-17

Gasoline only. n-Hexane data are needed to avoid default toxicity for EC6–EC8 aliphatics fraction, as in EPA Provisional Peer-Reviewed Toxicity Values (PPRTV).
BTEX Product, Soil, Water: EPA Method 8260*

Air: TO-15/TO-17

All petroleum types
MTBE, TBA Product, Soil, Water: EPA Method 8260*

Air: TO-15/TO-17

Gasoline only. Can be found at trace concentrations in other products due to cross-contamination in distribution systems.
Naphthalene Product, Soil, Water: EPA Methods 8260* or 8270* SIM

Air: TO-15/TO-17

All petroleum types

Note that EPA Method 8310 is not recommended due to potential co-elution problems.

2-Methylnaphthalene Product, Soil, Water: EPA Method 8270* SIM

Air: TO-17/TO-13A

All petroleum types. These data are needed to avoid default toxicity value for EC12 to EC16 aromatics fraction, as in EPA PPRTV

Note that EPA Method 8310 is not recommended due to potential co-elution problems.

PAHs Product, Soil, Water: EPA Method 8270D SIM

Air: TO-17/TO-13A

Only for products heavier than diesel 2 (e.g., crude oil, marine diesel, and bunker fuel)

Note that EPA Method 8310 is not recommended due to potential co-elution problems.

Lead scavengers:

Ethylene dichloride (EDC), ethylene dibromide (EDB)

Product, Soil, Water: EPA Method 8260*

Air: TO-15/TO-17

Pre-1997 automotive gasoline. Could potentially use Methods 8011 or 504.1/524.1 if needed for lower reporting limit (depends on state).
Organic (alkyl) lead (total and then speciated) Product: GC-ECD

Soil: EPA Method 8270* SIM

Water: EPA Method 8260* SIM

Pre-1997 automotive gasoline, or any aviation gasoline.

Note that CA HML-939M is not recommended due to potential for complexation of inorganic lead onto soil organic matter.

*most current version

5.10 Silica Gel Cleanup Method

At present, there is not a mechanism to separate hydrocarbons and metabolites for the bulk purgeable organics or gasoline range TPH.

A significant and well-known characteristic of the bulk GC-based TPH analytical methods is that nonhydrocarbon compounds (such as polar metabolites from TPH degradation) can be included in the TPH quantitation because FID is a nonspecific detector. For soil/sediment and water samples, a sample cleanup method can be added for the explicit purpose of trying to remove the extracted polar organics from the bulk sample so that the TPH quantitation is more representative of the actual petroleum hydrocarbons present. An example of the effects of these sample cleanup steps is shown in Figure 5-2. Furthermore, these methods can be used to separate aliphatic from aromatic fractions in the sample. There are several substrates available for this sample cleanup, including florisil (manganese silicate), alumina, and silica gel (SG), with silica gel cleanup (SGC) being the most common.

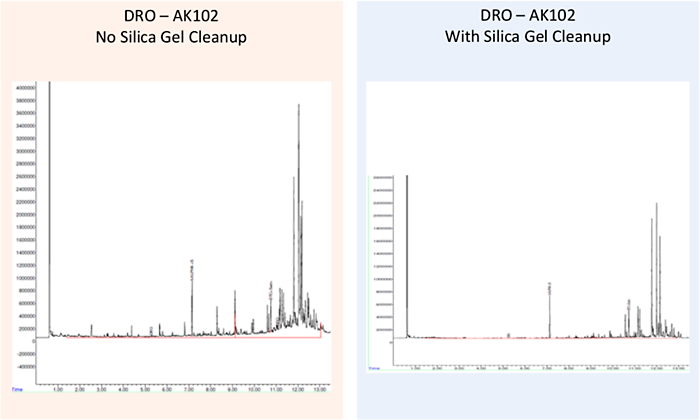
Figure 5‑2. Effects of sample cleanup on the quantitation of hydrocarbons in environmental samples.

▼Read more

SGC methods, including EPA Methods 418.1/1664A (SGT-HEM) and 3630C, and ISO Methods (used in Europe) 11046B (for soil) and 9377-2 (for water), generally involve the introduction of SG to the extraction sample to partition the polar compounds from the hydrocarbons and/or fractionate the sample into aliphatics and aromatics. However, the effectiveness of these methods can vary depending on the amount of SG used, the rinse solvent, and the separation step (shaking/stirring in the extraction vial or running the extract through an SG column) called for in the method Zemo, Synowiec, et al. 2013.

SGC is applicable only to extractable TPH measurements, and not to gasoline range TPH.

For sites contaminated with petroleum other than, or in addition, to gasoline, the first potential option would be to analyze samples using bulk extractable carbon range TPH with and without SGC to separate the bulk hydrocarbon and bulk polar (assumed to be metabolites) portions. In this way, the extractable metabolites would not be included as TPH and could otherwise be evaluated separately. This can be done by subtracting TPH concentrations derived with SGC from the bulk TPH concentrations without SGC. The use of SGC can also supplement information evaluating the different risks between TPH and metabolites using other methods, such as chronic toxicity evaluation as conducted for NPDES permit requirements (see Whole Effluent Toxicity Testing).

The distinction and separation of polar and nonpolar hydrocarbons are particularly important for groundwater samples because hydrocarbons have relatively low solubility and are not typically present in groundwater at elevated concentrations while polar compounds have relatively higher solubility and can be present in groundwater at relatively higher concentrations. Some additional points to consider associated with the decision to employ the sample cleanup approach include:

  • For purgeable constituents, or air-phase samples, there is no cleanup step available to separate the hydrocarbons and nonhydrocarbons in the sample due to the nature of analysis for volatiles. Therefore, careful evaluation of the sample chromatogram and discrete-constituent data is necessary.
  • These methods are not acceptable for typical gasoline range hydrocarbons because the volatiles in this fraction would be lost during the extraction and extract handling procedures.

If SGC is used, it is also critical that one or more representative background sample(s) are collected to assist in differentiating the naturally occurring oxygenated compounds and those originating from the release.

▼Read more

The nonhydrocarbons found in soil and groundwater at biodegrading petroleum release sites are most frequently oxygen-containing molecules that are metabolites from biodegradation of the petroleum, such as organic acids/esters, alcohols, ketones, aldehydes, and phenols Zemo and Foote 2003; Zemo, O’Reilly, et al. 2013; Lundegard and Sweeney 2004; Mohler et al. 2013. However, oxygen-containing nonhydrocarbons in a crude oil could have molecular structures similar to biodegradation products from oil recently spilled. In a somewhat special case of nonhydrocarbons, sulfur or sulfur-containing compounds have been found in groundwater extracts at sites where nonpetroleum organic matter from any origin is undergoing sulfate reduction Lundegard and Sweeney 2004.

Nonhydrocarbons can also be present in environmental samples due to (1) naturally occurring organics (e.g., humic acids, some plant waxes, plant essential oils), (2) sampling or lab artifacts (e.g., phthalates, equipment lubricants), or (3) nonpetroleum-related chemicals (e.g., solvents, creosote) Zemo, Bruya, and Graf 1995; Uhler, Stout, and McCarthy 1998. SGC may not be very effective on certain types of nonpetroleum organics if the compound has relatively lower polarity. For example, natural hydrocarbons like plant waxes, if present, would not be removed by SGC and could be mistaken for petroleum hydrocarbons. Several examples of constituents measured as petroleum hydrocarbons but found in nonpetroleum sources are shown in Figure 5-3.

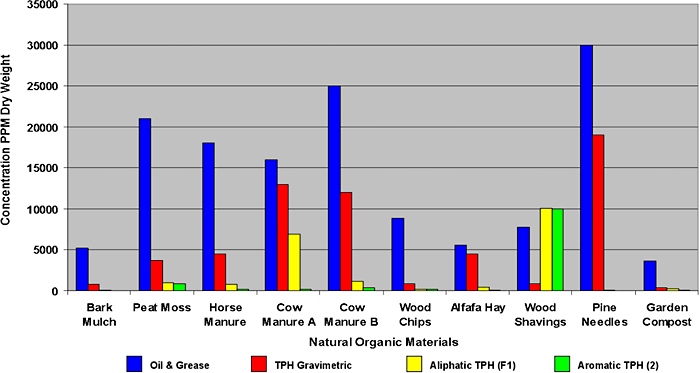
Figure 5‑3. Concentrations of petroleum hydrocarbons in natural organic materials as measured by TPH analytical methods.
(Source: G. Douglas et. al., NewFields Environmental. 2002)

Regardless of which SGC method is used, laboratory control samples should demonstrate that the polar compounds have been adequately removed using a polar surrogate such as capric acid added to all samples. Similarly, laboratory QA/QC samples should also be run using known hydrocarbon spikes such as fresh diesel or individual hydrocarbon compounds to demonstrate that hydrocarbons can be sufficiently recovered in the cleaned extract. The laboratory should also use standards that have undergone the same cleanup technique to calibrate the gas chromatograph before analysis.

▼Read more

Currently, it is still a challenge separating polar from nonpolar compounds using SGC (e.g., any moderately polar compounds will be retained in the silica matrix of a silica gel column, including any that increase in polarity as a result of biotransformation). This may result in incomplete separation of metabolites from nonpolar fractions. Although some well-resolved components could be eliminated by subtraction, incomplete separation does not address any unresolved complex mixture present.

Furthermore, interferences are most commonly attributed to low concentrations of contamination in the SG or lab glassware, or could be due to insufficient activation of the SG.

5.11 Reporting, Data Qualification, and Chromatograms

TPH results should be reported as detected only if the concentration is above the reporting limit (RL). Furthermore, it is imperative that the RLs (and not the method detection limits [MDLs]) for each method are evaluated versus the project screening criteria prior to submitting samples to the laboratory. The RLs should be below the project screening criteria to ensure achievement of project objectives. Lower screening criteria could result in the need for a different method, a method modification to lower the RLs (e.g., selective ion monitoring for the indicator compounds), or maybe a different laboratory.

▼Read more

Sometimes with lower RLs, the laboratory may have to perform dilutions that cause the RLs to be elevated. To ensure that the dilution performed was reasonable, a check should be made to determine if there are elevated concentrations of other target analytes in the sample. If there are other target analytes present at very high levels, then the dilution is likely justified and the presence of elevated RLs may not be an issue. However, if a dilution was performed without an obvious reason (e.g., low concentrations or nondetect results for target analytes), then the laboratory should provide an answer as to why the dilution was performed. This could happen due to elevated concentrations of nontarget compounds, typically for indicator compounds in VOC and SVOC GC/MS analyses.

For some methods that extract organics from soil and water, typically a 1 mL extract is generated. However, if the sample is excessively viscous, the laboratory may not be able to reduce the volume to the target amount. In this case, the excess volume of the extract results in a dilution factor that should be explained in the report from the laboratory. For example, if the target extract volume is 1 mL but the sample could be reduced only to 5 mL, then a 5-fold dilution should be reported and explained. For soil vapor or indoor air samples in canisters, if the vacuum is too high, the laboratory may overpressurize the canisters because the autosampler may not be able to extract the sample from the canister under such high vacuum. The overpressurization similarly results in a dilution factor.

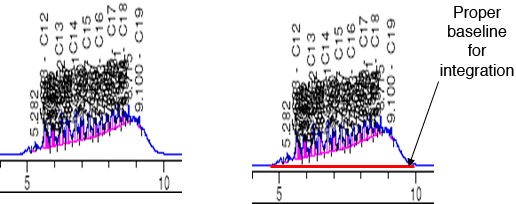
In addition to a numerical data package, TPH chromatograms can be obtained for most TPH methods (see Table 5-4). Chromatograms should be requested and reviewed to account for changes in the patterns due to various weathering processes and partitioning of hydrocarbons, depending on the medium sampled. For example, the chromatographic patterns of product samples may appear similar to patterns obtained from soil samples at the same site because the soil samples likely contained trapped or sorbed product under the same weathering conditions. Conversely, the partitioning of certain hydrocarbons to the water or vapor phases results in chromatographic patterns that are far different from the product. For additional information on chromatograms, see the Chromatograms: A Wealth of Information Fact Sheet.

▼Read more

TPH chromatograms have been used for decades to identify the petroleum constituents and “interferences” present in soil and groundwater samples Zemo, Bruya, and Graf 1995; Kaplan and Galperin 1996. The chromatograms from routine regulatory TPH analyses such as Method 8015 can be used if the resolution and scale are adequate (refer to Figure 2.1). However, the fact that the sample is separated into purgeable and extractable portions (except when using Method TX1005) must be considered in the interpretation. The highest quality chromatograms are those generated using high resolution GC/FID or GC/MS (total ion) for “forensic” analyses.

5.12 Data Usability, Interpretation, and Implications

When TPH data are collected, its usability has to be assessed, oftentimes by an expert with an understanding of the effects of the various sample collection methods, handling, and analytical steps taken to generate the data. The representativeness of traditional “discrete” sampling methods versus more recent “ISM-type” sampling methods is discussed in ITRC 2012 Brewer, Peard, and Heskett 2017a, 2017b. Additional data quality evaluations that may need to be considered include (found under Read more at bottom of page):

  • Potential Effects of Holding-Time Exceedances on TPH Results
  • Potential Effects of Blank Detections on TPH Data Interpretation
  • Potential Effects of Laboratory Control Sample Results on TPH Data Interpretation
  • Potential Effects of Surrogate Recoveries on TPH Data Interpretation
  • Potential Effects of Matrix Spike (MS)/MS Duplicates (MSD) on TPH Data Interpretation
  • Evaluating and Interpreting Breakthrough
  • Potential Effects of Co-Eluting Contaminants on TPH Results
  • Avoiding Double Counting of Indicator Compounds in Fractionated TPH Data
  • Potential Issues Associated with TPH Chromatograms
  • Evaluating Potential Uncertainty in TPH Data

Once the data have been determined to be representative of site conditions and usable, the interpretation and implications of the data for a specific petroleum release, the associated CSM, and subsequent TPH risk assessment can begin. Some specific examples include:

  • The ratio of bulk-to-SGC TPH results can give important information relevant to the CSM about the degradation stage of petroleum and zonation HIDOH 2017 in the dissolved plume. For example, a bulk-to-SGC TPH ratio of 1 is associated with fresher, more un-degraded material, but there is also potential misinformation associated with data generated using SGC (see Silica Gel Cleanup Method and the Silica Gel Cleanup Fact Sheet). A high bulk-to-SGC TPH ratio may indicate a weathered product.
  • If nonhydrocarbons are also found upgradient or cross-gradient of the source area, they are typically a result of natural organics, ambient organics unrelated to the petroleum source, or lab/equipment contamination. If the nonhydrocarbons are found only in samples within and downgradient of a biodegrading petroleum source area, and not in the upgradient or cross-gradient samples, they are most likely metabolites and confirmation of ongoing transformation of TPH.
  • Chromatograms are useful for forensic (“fingerprint”) analyses to determine product type, degree of weathering and degradation, relative age dating, and general environmental forensic characteristics.

▼Read more

5.12.1 Potential Effects of Holding-Time Exceedances on TPH Results

When holding times are missed, there is the potential for the TPH data to be biased low. The magnitude of the bias is dependent on the extent of the holding-time exceedance, the matrix (including the presence and abundance of hydrocarbon-degrading microbes), and preservation/collection methods, as well as the type of petroleum product causing the contamination. The lighter, more volatile petroleum products (e.g., gasoline, Stoddard solvent, kerosene) will be affected more significantly by a holding-time exceedance than the heavier petroleum products (e.g., fuel oil #6, motor oil).

Generally, the rule of thumb is that if the extraction and/or analysis holding time is grossly exceeded USEPA 2017d, nondetect TPH results may be considered unusable for project objectives. However, professional judgment based on the nature of the petroleum product, etc., may be used to determine the ultimate effect on the data.

5.12.2 Potential Effects of Blank Detections on TPH Data Interpretation

If there is TPH or hydrocarbon range contamination in a laboratory method or field blank, this may be caused from extraneous peaks, column bleed, equipment contamination, or possibly something that is within the laboratory’s control that probably should have been fixed prior to analyzing the samples. Many times, it is not due to a petroleum hydrocarbon pattern so when comparing blank results to sample results, it is best to review the chromatograms of both the blanks and the samples to make sure the contamination is the same pattern in both before applying the 2x rule described below. If the chromatographic profile does not match the profile found in the blank, applying the 2x rule would result in a false negative.

The general rule of thumb to follow during this evaluation is that if the concentration in the sample is less than 2x the blank concentration and the petroleum hydrocarbon contamination pattern in the sample matches the petroleum hydrocarbon contamination pattern in the blank, the result in the sample is potentially a false positive. Note that the use of 2x the blank concentration is provided as a general guideline USEPA 2017d; local regulatory data evaluation guidelines should be referenced.

Furthermore, blanks should be scrutinized to help determine whether results near the method detection limit are indeed accurate or potentially false positives.

5.12.3 Potential Effects of Laboratory Control Sample Results on TPH Data Interpretation

For different TPH analyses, the analytes spiked into a laboratory control sample (LCS) vary depending on the method to be performed. For example, fuel oil #2 may be used for DRO analyses, individual hydrocarbon components may be included for VPH/EPH analyses, etc. In the case of EPA 8015 analyses, a study USDOD 2018 generated the performance-based limits summarized in Tables 5-6 and 5-7 (adapted from DOD QSM 5.1 Appendix C).

Table 5‑6. LCS control limits for SW-846 8015(mod) solid matrix in percent
(Source: DoD,2017.)

CAS No Analyte Number of Records Mean Standard Deviation Lower Control Limit Upper Control Limit
303-04 Diesel range organics (DRO) 2184 85.2 15.7 38 132.4
307-27 Gasoline range organics (GRO) (G(GRO)(GRO) 1134 100.3 7.2 78.7 122
307-51 Motor oil (RRO) 658 72.2 11.2 38.7 105.8

Table 5‑7. LCS control limits for SW-846 8015(mod) water matrix in percent
(Source: DoD,2017.)

CAS No Analyte Number of Records Mean Standard Deviation Lower Control Limit Upper Control Limit
303-04 DRO 1757 83.7 16 35.6 131.8
307-27 GRO 971 99.9 7.3 78 121.8
307-51 RRO 573 76.9 12.1 40.7 113.2

The results of the LCS affect the entire batch of samples prepared or analyzed with the LCS, depending on the method. If LCS recoveries are outside the acceptance limits, the following guidelines are used in the assessment of the data:

  • If low recoveries, then there is a potential low bias for that analyte in all associated samples in the batch: affects detected and nondetect results.
  • If high recoveries, then there is a potential high bias for that analyte in all associated samples in the batch: affects only detected results.
  • If recoveries are significantly low (<10%), nondetect results for that analyte in all associated results in the batch may not be usable for project objectives.
  • If LCS/lab control sample duplicate (LCSD) relative percent differences (RPDs) are higher than the acceptance criteria, both detected and nondetect results are uncertain but the bias is considered indeterminate.

5.12.4 Potential Effects of Surrogate Recoveries on TPH Data Interpretation

Table 5-8 summarizes some of the analytical/extraction surrogates typically used in TPH and related analyses. Surrogate recoveries can be impacted by different pH conditions. If not noted, QA/QC results could indicate that the sample result is invalid because of low surrogate recovery, although the sample results are in fact due to something inherent in the sample that can have important implications on site conditions.

Table 5‑8. Surrogate compounds typically used in TPH analyses

Analytical Method Example Analytical/Extraction Surrogates
Alaska: Method 101-GRO (AK-101; C6-C10) 4-Bromofluorobenzene
ααα-Trifluorotoluene
Alaska: Method 102-DRO (AK-102; C10-C25) o-Terphenyl (OTP)
Alaska: Method 103-RRO (AK-103; C25-C36) n-Triacontane-d62
CTDEEP, MassDEP, and NJDEP EPH Aromatic fraction: OTP
Aliphatic fraction: Chloro-octadecane (COD)
CTDEEP and MassDEP VPH by GC/PID/FID 2,5-Dibromotoluene
Florida: Petroleum range organics (FL-PRO) o-Terphenyl and nonatriacontane (C39)
Massachusetts: MassDEP VPH by GC/MS Toluene-d8
Northwest (OR and WA) TPH-Gx 1,4-Difluorobenzene
4-Bromofluorobenzene
Northwest (OR and WA) TPH-Dx One of the following:
2-Fluorobiphenyl
OTP
p-Terphenyl
Pentacosane
Northwest (OR and WA) TPH-HCID 4-Bromofluorobenzene
Pentacosane
Tennessee: EPH OTP
Texas: TCEQ-1005 and TCEQ-1006 C6-C12: Trifluoromethylbenzene or 1-Chlorooctane
>C12: COD, 2-Fluorobiphenyl, or OTP
GRO One of the following:
ααα-Trifluorotoluene
1-Chloro-4-fluorobenzene
4-Bromofluorobenzene
1-Chlorooctane
DRO One of the following:
2-Fluorobiphenyl
OTP
p-Terphenyl
5-α-androstane
COD
SGC Capric acid

If surrogate recoveries are outside of the acceptance limits, the guidelines shown in Table 5-9 are used in the assessment of the data:

Table 5‑9. Out of bounds surrogate recovery guidelines

Data Type Recovery1 Potential Effects on Sample Data
Unfractionated TPH Data Surrogate high (>140% for EPH/DRO, >130% for VPH/GRO)

Surrogate low ( <40% for EPH/DRO, <70% VPH/GRO)

Surrogate very low (<10%)

High bias on detects

Low bias on detects and nondetects

Data may not be usable

Fractionated TPH Data Aliphatic surrogate high

Aromatic surrogate high

Aliphatic surrogate low

Aromatic surrogate low

Aromatic or aliphatic surrogate very low (<10%)

High bias on aliphatic range detects

High bias on aromatic range and aromatic target analyte (e.g., BTEX, PAHs) detects
Low bias on aliphatic range detects and nondetects
Low bias on aromatic range and aromatic target analyte (e.g., BTEX, PAHs) detects and nondetects
Data may not be usable

TPH Data Where SGC is Performed Capric acid (CAS No. 334-48-5) recovery ≤ 5%

Capric acid recovery> 5%

SGC was effective

High bias for TPH—all of the polar compounds may not have been removed

1Note: High and low recoveries are method-dependent.

Note that there would be no effect on the usability of the data if the surrogate recovery is outside acceptance limits and a significant dilution was performed on the sample (greater than 5-fold dilution). The guidelines listed above may not apply if the sample chromatogram indicates significant interference in the area where the surrogate elutes. In these instances, matrix interference is causing problematic surrogate recoveries and the evaluation of sample biases due to surrogate recoveries may not be possible. Therefore, it is important that the chromatogram is provided by the laboratory and included in the evaluation of sample data due to surrogate nonconformances.

5.12.5 Potential Effects of Matrix Spike (MS)/MS Duplicates (MSD) on TPH Data Interpretation

If MS or MSD recoveries are outside the acceptance limits, the following guidelines are used in the assessment of the data:

  • If low recoveries, then there is a potential low bias for that analyte in the sample that was spiked: affects detected and nondetect results.
  • If high recoveries, then there is a potential high bias for that analyte in the sample that was spiked: affects only detected results.
  • If recoveries are significantly low (<10%), nondetect results for that analyte in the sample that was spiked may not be usable for project objectives.

The above guidelines do not apply to samples that already contain TPH at concentrations significantly (greater than 4x) exceeding the spike amount.

5.12.6 Evaluating and Interpreting Breakthrough

The amount of solvent (i.e., hexane) used to elute the aliphatic component of the hydrocarbon mixture is critical. An excessive volume of solvent may cause the lighter aromatics to break through and be captured in the aliphatic fraction while an insufficient volume of solvent may allow some of the heavier aliphatic hydrocarbons to be retained on the silica gel cartridge/column, resulting in a lower recovery for these aliphatic fractions. Depending on the analytical conditions, this could result in an underestimation of the aromatic carbon range concentration for the excessive solvent condition or an overestimation of the aromatic carbon range concentration for the deficient solvent condition. If aromatic breakthrough is suspected, the aliphatic fraction may be analyzed to determine if naphthalene or any of the other more “mobile” aromatics are present.

Each sample (field and QC sample) must be evaluated for potential breakthrough on a sample-specific basis by evaluating the percent recovery of the fractionation surrogates and on a batch basis by quantifying naphthalene and 2-methylnaphthalene in both the aliphatic and aromatic fractions of the LCS and LCSD. If the concentration of either naphthalene or 2-methylnaphthalene in the aliphatic fraction exceeds 5% of the total concentration for naphthalene or 2-methylnaphthalene in the LCS or LCSD, then there are potential biases to the data.

  • Potential low bias exists for the aromatic fraction (≥C11), naphthalene, and 2-methylnaphthalene results in all associated samples.
  • Potential high bias exists for the lower carbon range aliphatics (≥C9) in all associated samples.

It should be noted that breakthrough could also occur on an individual sample basis, regardless of whether the LCS exhibited acceptable fractionation results. If the sample contains a high content of PAHs/hydrocarbons, it is possible that PAHs may break through into the aliphatic fraction. This would not be as obvious, because analyses of sample aliphatic fractions for naphthalene and 2-methylnaphthalene are not required. Review of fractionation surrogate recoveries and sample chromatograms can assist in the determination of whether any significant breakthrough has occurred in a sample; low recoveries of fractionation surrogate in the aromatic fraction may indicate a potential breakthrough issue in a sample. In such cases, special considerations may be required (e.g., dilution required prior to re-fractionation). It should be noted that acceptable recovery of the fractionation surrogates may not always provide absolute confirmation that effective separation of the aliphatic fraction from the aromatic fraction of the sample extract has been accomplished.

There is also the possibility of breakthrough of aliphatics, like n-alkanes, in crude oils and diesel fuels to the aromatic fraction. This could be a source of high bias in the aromatic fraction. This is relatively easy to “see” upon inspection of the chromatograms but not easy to correct.

It should be noted that SGC is not 100% selective. There may be some aliphatics in the aromatic fractions and vice versa. For un-degraded crude oils, for example, that have high n-alkane content, even 90%+ selectivity/efficiency of the silica gel would result in some of the n-alkanes being visible in the aromatic fraction. This may not be breakthrough per se, just not 100% selectivity. Also, as the degree of substitution increases around an aromatic core, the aromatic character is reduced and not necessarily selective to the silica gel; some of the alkylated substituted aromatics with aliphatic side chains will split into the aliphatic and aromatic fractions and at some point, the highly alkylated aromatics will end up with the aliphatics. This may be acceptable from a risk assessment perspective because the aromaticity of these highly alkylated aromatic compounds is not dominant and these compounds may likely behave as aliphatics in the environment.

5.12.7 Potential Effects of Co-Eluting Contaminants on TPH Results

Chlorinated solvents can give rise to false positives for TPH. Table 5-10 summarizes some common nonpetroleum contaminants that can cause false positive results in the volatile TPH (e.g., VPH and GRO) analyses.

Table 5‑10. Potential nonpetroleum interferences MADEP 2009
(Source: MaDEP, 2009.)

Hydrocarbon Range Potential Nonpetroleum Compounds
C5–C8 Aliphatic Hydrocarbons Acetone may co-elute/interfere with isopentane

Isopropyl alcohol, methyl ethyl ketone, trichloroethene, tetrachloroethene, tetrahydrofuran, hexanal, 1-butanol, hexamethylsiloxane

C9–C12 Aliphatic Hydrocarbons Terpenes (e.g., a-pinene, d-limonene), phenol, benzaldehyde, n-chain aldehydes, 2-ethyl-1-hexanol, siloxanes, dichlorobenzenes
C9–C10 Aromatic Hydrocarbons Siloxanes, a-pinene, and d-limonene may slightly interfere (contribute to the area of ions 120/134) if present at high concentration

5.12.8 Avoiding Double Counting of Indicator Compounds in Fractionated TPH Data

Many of the fractionated TPH methods (e.g., VPH and EPH) report aliphatic and aromatic hydrocarbon ranges as well as target indicator compounds (e.g., BTEX or PAHs). During the analysis of samples by these methods, the concentrations of target compounds that fall chromatographically within specific hydrocarbon ranges are excluded from the hydrocarbon range data because the target compounds and hydrocarbon ranges are evaluated for risk separately. Double counting refers to the instance where this correction is not made to the hydrocarbon range data, thereby resulting in high-biased hydrocarbon range results and an overestimation of TPH risk. It should be noted that correction to the hydrocarbon range data for target compounds should be done using the target compound concentrations derived from the method of analysis used for reporting the hydrocarbon range data. For example, correcting VPH by GC/PID/FID data by subtracting out BTEX concentrations determined by Method 8260 is not appropriate. Instead, the BTEX values determined by the VPH by GC/PID/FID method should be used for correcting the hydrocarbon range data in this case. Risk must be evaluated using benchmarks based on whether the data are or are not corrected for target compound concentrations.

5.12.9 Potential Issues Associated with TPH Chromatograms

Due to the nonspecific nature of the TPH analysis, TPH chromatograms should be routinely reviewed as part of the QA/QC process before TPH analytical results are used for decision making. TPH chromatograms should be reviewed to resolve issues associated with overlapping reporting ranges even though a single product type is known to exist at a site. As shown in Figure 5-4, the only product present in this example is diesel fuel #2; however, concentrations of GRO would also be reported even though gasoline was not present. It should be noted that some analytical methods do not have overlapping carbon ranges, thus avoiding this problem.

Figure 5‑4. Example of overlapping reporting ranges for TPH Zemo 2016.
(Source: Zemo, 2016.)

Using the proper baseline for adequate integration for calculation of TPH concentrations is critical particularly for lower concentrations and higher carbon ranges where the baseline starts to rise with temperature.

TPH chromatograms can also exhibit “drifting baselines.” This phenomenon can occur due to carryover from previous analyses of dirty samples or an instrument gradually cleaning itself if it was calibrated following dirty samples. Likewise, the FID signal can gradually increase as the GC column heats, producing a baseline that ramps up on a very subtle level. The most common problem that this presents is that laboratories may select the baseline as the bottom of the resolvable peaks that do not include all of the mass in the unresolved complex mixture (UCM). This improper baseline integration can result in reported concentrations that are significantly lower than what is actually present. Figure 5-5 illustrates this concept.

Figure 5‑5. Baseline integration example: Drifting baseline.

5.12.10 Evaluating Potential Uncertainty in TPH Data

Estimating the error associated with individual results will ultimately impact the uncertainty associated with the assessment of risk. The heterogeneity of the sampled matrix, particularly soil or sediment, may be of concern, as it may cause the overall error to be unacceptably large, may limit the usability of the data (or may even render data unusable), and could ultimately result in the need for resampling Gy 1998; Pitard 1993; HIDOH 2016; ITRC 2012. The uncertainties in results are exacerbated by releases of multiple types of petroleum products, releases over time, and/or if the evaluation of degradation products are included in the investigation.

To identify uncertainties and errors in data, DQOs set during the development of the TPH data collection plan should be consulted and thoroughly discussed while the plan itself is being developed. If unacceptable errors are found, adjustments to the data collection plan may need to be implemented for any additional sampling, including additional replicates, QA/QC samples, and a deeper evaluation of the source(s) of the errors. In addition to using the DQOs included in a data quality review, the evaluation of the usability of TPH data should always include a review of sample chromatograms (see the 2x blank rule, for example). Even if data should be rejected based on severe QC issues, this does not automatically indicate that resampling/reanalysis is required. Rather, the entire data set and other lines of evidence should be evaluated to determine whether the data gap is critical, thereby requiring corrective action.

image_pdfPrint this page/section


TPHRisk-1

web document
glossaryTPHRisk-1
Glossary
referencesTPHRisk-1
References
acronymsTPHRisk-1
Acronyms

ITRC
Contact Us
About ITRC
Visit ITRC
social media iconsClick here to visit ITRC on FacebookClick here to visit ITRC on TwitterClick here to visit ITRC on LinkedInITRC on Social Media
about_itrc
Permission is granted to refer to or quote from this publication with the customary acknowledgment of the source (see suggested citation and disclaimer). This web site is owned by ITRC • 1250 H Street, NW • Suite 850 • Washington, DC 20005 • (202) 266-4933 • Email: [email protected] • Terms of Service, Privacy Policy, and Usage Policy ITRC is sponsored by the Environmental Council of the States.